
Introduction
InfluxDB v2 beta is out. When you are used to versions 1.x, many changes in version 2. For more informations about InfluxDB v.7 : Understanding, installing and using the time series database InfluxDB 1.7
Migration procedure from version 1.x to version 2 is not yet unveiled, surely it will preconize export/import methods.
First thing to know : an InfluxDB v1 database is now an InfluxDB bucket in version 2, and a mandatory organization is associated to a bucket. So obviously, at least one organization must be defined, definition performed when installing an InfluxDB v2 server.
- TSI index is the default storage index engine, In-Memory index is removed.
- Chronograf (visualization tool) is integrated to InfluxDB.
- Flux is the default language and InfluxQL is unfortunately removed.
- Continuous queries are replaced by tasks.
- Native support for OpenTSDB, Graphite, CollectD… protocols is also unfortunately removed in InfluxDB v2, Telegraf agents must be used.
The migration will need adjustments, many InfluxDB v1 functionalities are replaced or removed in version 2.
Installation
It is a non-root installation, Linux 64 bits binaries version 2.0 beta 2 are downloaded from InfluxDB Web Site.
Installation is performed by the user influxdb in the directory /opt/influxdata/influxdb-2.0-beta2.
influxdb% cd /opt/influxdata
influxdb% wget https://dl.influxdata.com/influxdb/releases/influxdb_2.0.0-beta.2_linux_amd64.tar.gz

influxdb% mkdir influxdb-2.0-beta2
influxdb% tar xvzf influxdb_2.0.0-beta.2_linux_amd64.tar.gz -C influxdb-2.0-beta2 --strip-components 1

influxdb% ln -fs influxdb-2.0-beta2 influxdb-2.0
A symbolic link influxdb-2.0 to the directory influxdb-2.0-beta2 is created to ease versions management.
In version 2 beta 2, just 2 binaries installed in this directory : the server influxd and the client influx. There is
(not yet ?) any configuration file.
Useful environment variables are created and the path to the InfluxDB v2 binaries is added to the environment variable $PATH :
influxdb% export IFXHOME=/opt/influxdata/influxdb-2.0
influxdb% export IFXSRVNAME=srvifx2

influxdb% export LOG=/opt/influxdata/dba/${IFXSRVNAME}/log
influxdb% export SCRIPTS=/opt/influxdata/dba/${IFXSRVNAME}/scripts

influxdb% export PATH=${IFXHOME}:$PATH
Initialization
Initialize the database with bolt-path and engine-path options. These 2 options will repectively customize the bolt
database and the engine database locations, otherwise they are created in the directory $HOME/.influxdbv2.
influxdb% nohup influxd  --bolt-path=/sqlpac/influxdb/${IFXSRVNAME}/srvifx2.bolt \
                   --engine-path=/sqlpac/influxdb/${IFXSRVNAME} \
                   --http-bind-address=":9999" >> $LOG/srvifx2.log 2>&1 &
Time series
buckets will be stored in the directory --engine-path. A new bolt database is created with version 2 (--bolt-path) :
it will store users, organizations, security tokens, authorizations, tasks, dashboards definitions, endpoints…
In version 2 beta 2, default port is 9999 for the moment to not interfere with running InfluxDB v1.x on port 8086.
The integrated visualization tool will be more used in version 2 than Chronograf in version 1 due to the language Flux complexity, hard to learn, SSL should be implemented, this point is discussed further.
The setup is not yet completed, the default user, organization and bucket must be initialized. Choose cautiously these values. Run influx setup to initialize :
influxdb% influx setupWelcome to InfluxDB 2.0! Please type your primary username: dba Please type your password: Please type your password again: Please type your primary organization name: sqlpac Please type your primary bucket name: masterts Please type your retention period in hours. Or press ENTER for infinite.: You have entered: Username: dba Organization: sqlpac Bucket: masterts Retention Period: infinite Confirm? (y/n): y Your token has been stored in /opt/influxdata/.influxdbv2/credentials. User Organization Bucket dba sqlpac masterts
A token is created in the file $HOME/.influxdbv2/credentials (/opt/influxdata/.influxdbv2/credentials).
Keep cautiously this token, it is the system administrator’s token.
Using influx client
InfluxQL shell commands are no more available (SHOW DATABASES, CREATE DATABASE…).
The client influx must be invoked with parameters.
Buckets management
To list buckets (organization is required) :
influxdb% influx bucket find --org sqlpacID Name Retention OrganizationID df913a2a0974f86a masterts 0s e71686ff910f3f32 000000000000000a _tasks 72h0m0s 000000000000000b _monitoring 168h0m0s
The 1.x system database _internal does not exist anymore. With version 2 two system buckets : _tasks
and _monitoring.
To create a bucket :
influxdb% influx bucket create --org sqlpac --name netdatatsdbID Name Retention OrganizationID 5b65ed72bde3059b netdatatsdb 0s e71686ff910f3f32
The default retention is infinite by default, a retention can be defined when creating a bucket :
influxdb% influx bucket create --org sqlpac --name telegraf --retention 48hID Name Retention OrganizationID 1551723bb12b1b41 telegraf 48h0m0s e71686ff910f3f32
The retention can be modified later (unfortunately in some commands the id must be specified, not the name) :
influxdb% influx bucket update --id 1551723bb12b1b41 --retention 72hID Name Retention OrganizationID 1551723bb12b1b41 telegraf 72h0m0s e71686ff910f3f32
Using environment variables $INFLUX_%
Most commands will require organization name or id, bucket name… as arguments. Environment variables can ease influx command
lines usage :
influxdb% export INFLUX_ORG=sqlpac influxdb% influx bucket findID Name Retention OrganizationID 1551723bb12b1b41 telegraf 72h0m0s e71686ff910f3f32 5b65ed72bde3059b netdatatsdb 0s e71686ff910f3f32 df913a2a0974f86a masterts 0s e71686ff910f3f32
The following useful environment variables can be defined :
$INFLUX_ORG |
Organization Name |
$INFLUX_BUCKET_NAME |
Bucket Name |
$INFLUX_TOKEN |
Token to use if it is not the administrator’s token from the file $HOME/.influxdbv2/credentials |
$INFLUX_HOST |
Influx DB host if is not the default one (http://localhost:9999).
This variable will be useful when setting up https/ssl |
Users and authorizations
InfluxDB v2 offers better security and authorizations management (stored in the bolt database) :
To create a user :
influxdb% influx user create --name telegraf --org sqlpac --password "*************"ID Name Organization ID 0539a982fcd5d000 telegraf e71686ff910f3f32
Then authorizations are defined for the user, in the example below, the user telegraf is allowed to read and writes in its
organization buckets :
influxdb% influx auth create --user telegraf --read-buckets --write-bucketsID Token Status UserID Permissions 0539aad15315d000 TXds8JZO0El46vybQROsjqsaM44fkLg_ghm6V6dkLxzYIyzey-cDKzaE7TLVUQUvwosidjkt9DPrMH8zSKGitA== active 0539a982fcd5d000 [read:orgs/e71686ff910f3f32/buckets write:orgs/e71686ff910f3f32/buckets]
The token is important, this one will be used for connecting to the InfluxDB server with the appropriate rights.
Many authorizations can be defined (reads, writes on buckets, dashboards, tasks…) : use influx auth create --help for
a complete list.
influxdb% influx user findID Name 053998e902d5d000 dba 0539a982fcd5d000 telegrafinfluxdb% influx auth findID Token Status User UserID Permissions 053998e91e55d000 kG0… active <nil> 053998e902d5d000 [read:authorizations write:authorizations read:buckets write:buckets read:dashboards write:dashboards read:orgs write:orgs read:sources write:sources read:tasks write:tasks read:telegrafs write:telegrafs read:users write:users read:variables write:variables read:scrapers write:scrapers read:secrets write:secrets read:labels write:labels read:views write:views read:documents write:documents read:notificationRules write:notificationRules read:notificationEndpoints write:notificationEndpoints read:checks write:checks] 0539ada78c95d000 8on… active <nil> 0539a982fcd5d000 [read:orgs/e71686ff910f3f32/buckets write:orgs/e71686ff910f3f32/buckets]
Reading series
Translating InfluxQL queries to Flux language is really not obvious, further more, important note : a range time is now mandatory in Flux language, otherwise the query fails with the error below :
Error: Failed to execute query: compilation failed: cannot submit
unbounded read to "netdatatsdb"; try bounding 'from' with a call to 'range'.| InfluxQL | Flux |
|---|---|
|
|
About learning Flux language, the 2 publications below may help :
- SQLPAC - InfluxDB v2 : Flux language, quick reference guide and cheat sheet
- SQLPAC - InfluxDB, Moving from InfluxQL to Flux language
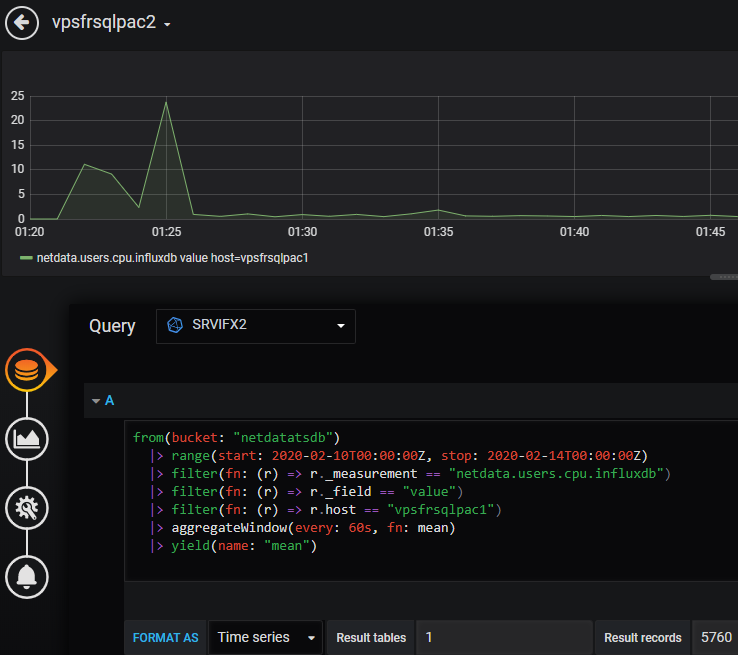
Use influx with the option query and give the path to the Flux script, giving the Flux commands in
one single command line is really too streneous :
$SCRIPTS/script1.flux
from(bucket: "netdatatsdb")
  |> range(start: 2020-02-10T00:00:00Z, stop: 2020-02-11T00:00:00Z)
  |> filter(fn: (r) => r._measurement == "netdata.users.cpu.influxdb")
  |> filter(fn: (r) => r._field == "value")
  |> filter(fn: (r) => r.host == "vpsfrsqlpac1")
  |> aggregateWindow(every: 60s, fn: mean)
|> yield(name: "mean")influxdb% export INFLUX_ORG=sqlpac influxdb% influx query @$SCRIPTS/script1.fluxResult: mean Table: keys: [_start, _stop, _field, _measurement, host] _start:time _stop:time _field:string _measurement:string host:string _value:float _time:time ------------------------------ ------------------------------ ---------------------- -------------------------- ---------------------- ---------------------------- ------------------------------ 2020-02-10T00:00:00.000000000Z 2020-02-11T00:00:00.000000000Z value netdata.users.cpu.influxdb vpsfrsqlpac1 1.0997225 2020-02-10T00:43:00.000000000Z 2020-02-10T00:00:00.000000000Z 2020-02-11T00:00:00.000000000Z value netdata.users.cpu.influxdb vpsfrsqlpac1 0.7442834833333333 2020-02-10T17:44:00.000000000Z 2020-02-10T00:00:00.000000000Z 2020-02-11T00:00:00.000000000Z value netdata.users.cpu.influxdb vpsfrsqlpac1 0.9031700333333332 2020-02-10T00:45:00.000000000Z
The transpile option
The transpile option translates InfluxQL queries to the Flux syntax. Results are reliable (not fully) and
useful when beginning in Flux language :
influxdb% influx transpile \ 'SELECT mean("value") AS "mean_value" FROM netdatatsdb.."netdata.users.cpu.influxdb" WHERE time >= now() -1h and time < now() and "host"='vpsfrsqlpac1' GROUP BY time(60s) FILL(null)'from(bucket: "netdatatsdb") |> range(start: 2020-02-10T12:59:32.850621715Z, stop: 2020-02-10T13:59:32.850621714Z) |> filter(fn: (r) => (r._measurement == "netdata.users.cpu.influxdb" and r._field == "value")) |> filter(fn: (r) => (r["host"] == r["vpsfrsqlpac1"])) |> group(columns: ["_measurement", "_start"], mode: "by") |> window(every: 1m) |> mean() |> duplicate(column: "_start", as: "_time") |> window(every: inf) |> map(fn: (r) => ({_time: r._time, mean_value: r._value}), mergeKey: true) |> yield(name: "0")
Update (March 9 2021) : the transpile option will be deprecated in
next versions - GitHub Influxdata/Influxdb, fix(cmd/influx): delete unsupported influx transpile command
Integrated query tool
The best option is to use the integrated visualization tool, Chronograf is no more a separate tool. This tool is very intuitive.
So if necessary manage the firewall rules to open the port 9999 and create the users with the appropriate authorizations to give access, in the example below
the user netdata_ro with read buckets and read/write dashboards authorizations is created :
http://localhost:9999influxdb% influx user create --name netdata_ro --password "*******"
influxdb% influx auth create --user netdata_ro --org sqlpac --read-buckets --read-dashboards --write-dashboards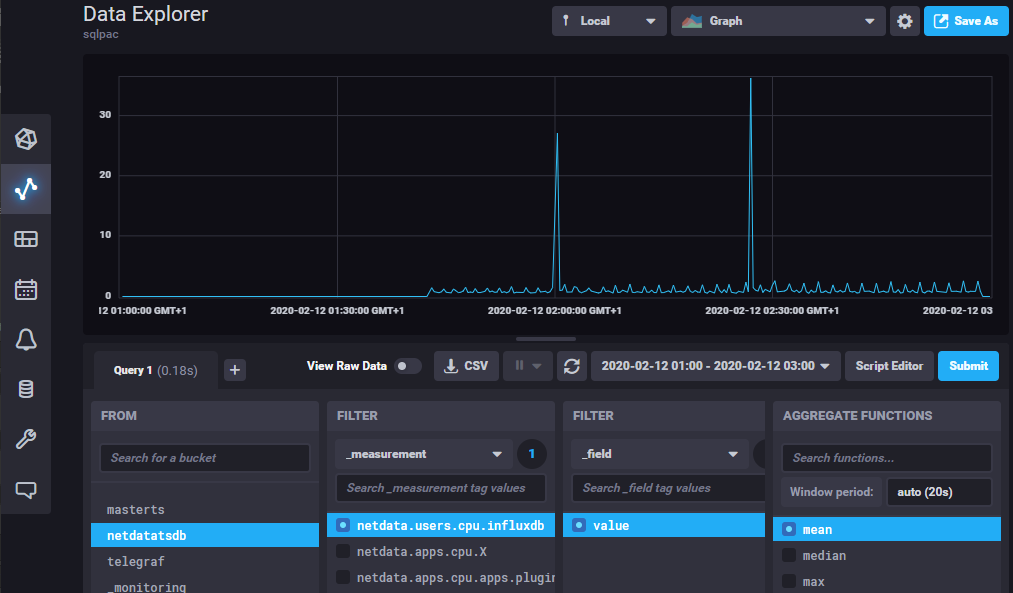
Writing series
InfluxDB Line protocol
No difference compared to InfluxDB v1.x, points are written with the InfluxDB Line Protocol. Use influx write
to write points to series :
influxdb% export INFLUX_ORG=sqlpac
influxdb% export INFLUX_BUCKET_NAME=netdatatsdb

influxdb% influx write --precision s 'customMeasure,host=vpsfrsqlpac1 cpupct=23.4,slot=1i,isdefault=true 1581321757'- The timestamp server is used when it is omitted in the line.
- Integer datatype instead of float is forced by adding
iafter the value when inserting the first point. The suffixuis used to specify unsigned integers. - Boolean datatype is applied when writing
t|trueorf|falsewithout quotes or double quotes when inserting the first point.
Applying the right data type enforces data integrity and reduces memory and space usage.
Error: Failed to write data: unexpected error writing points to database: partial write: series type mismatch: already Integer but got Float dropped=1.Bulk loads
Lines can be imported from a text file, it works well throug the user interface (Load Data Buckets
Add data Line Protocol Upload File) but
command lines raise errors when the text file exceeds an amount of data (Bad Timestamp…). The product is still in
beta phase with enhancements to be released for bulk imports (README file), so let’s wait for the next beta versions for
the moment. Anyway, the syntax looks like this one :
influxdb% influx write --bucket netdatatsdb --precision s @data.txtSELECT INTO, function to()
In InfluxDB v1.7, SELECT INTO statements enable data copy from one measurement to another.
With InfluxDB v2, use the function to() :
from(bucket: "netdatatsdb")
  |> range(start: -30d)
  |> filter(fn: (r) => r._measurement == "netdata.users.cpu.influxdb")
  |> filter(fn: (r) => r._field == "value")
  |> filter(fn: (r) => r.host == "vpsfrsqlpac1")
  |> to(bucket: "history", org: "sqlpac")
To write into the same bucket, the function set is applied to modify the key _measurement :
from(bucket: "netdatatsdb")
  |> range(start: -30d)
  |> filter(fn: (r) => r._measurement == "netdata.users.cpu.influxdb")
  |> filter(fn: (r) => r._field == "value")
  |> filter(fn: (r) => r.host == "vpsfrsqlpac1")
  |> set(key: "_measurement", value: "cpu_influxdb")
  |> to(bucket: "netdatatsdb", org: "sqlpac")
Metadata informations
Where are the SHOW commands retrieving metadata informations ?
That’s the big question when running for the first time an InfluxDB v2 server : where are the favourite commands listing the informations
about measurements, series, tag keys, tag values, field keys ? SHOW MEASUREMENTS, SHOW SERIES, SHOW TAG KEYS FROM,
SHOW TAG VALUES FROM, SHOW FIELD KEYS FROM.
Some helper functions are available but they do not have the full capabilities offered by the version 1.x SHOW commands.
Further more, some helper functions depend now unfortunately on ranges of time (-30d) and
then are not accurate when searching older metadata.
To use these functions, the package influxdata/influxdb/v1 is imported. Not easy when you are not yet used to, here are some basic translations :
| InfluxQL | Flux |
|---|---|
|
|
|
|
|
|
Range of times may need to be adjusted. For example, the source code of the function v1.measurementTagKeys
relies on the function tagKeys which uses the interval -30d,
thus when searching older keys this interval must be customized :
|
|
Basically, compared to InfluxDB v1, the visualization tool is now often more preferable with InfluxDB v2 and Flux.
Continuous queries and Influx v2 : tasks
About continuous queries, for example this continuous query with an interval of 5 min :
CREATE CONTINUOUS QUERY cq_influxdb1_cpu ON netdatatsdb
BEGIN
  SELECT mean(value) INTO netdatatsdb.autogen.avg_influxdb1_cpu
  FROM netdatatsdb.autogen."netdata.users.cpu.influxdb"
  WHERE host = 'vpsfrsqlpac1' GROUP BY time(5m)
END
The continuous query must be migrated to a task, with a syntax a bit more complicated and a mandatory range of time, but the ability to insert more logic and to use the new Flux language features (joins, external data sources…) which was not possible in InfluxQL continuous queries syntaxes :
task_influxdb1_cpu.flux
option task = {name: "task_influxdb1_cpu", every: 5m}

data = from(bucket: "netdatatsdb")
	|> range(start: -duration(v: int(v: task.every) * 2))
	|> filter(fn: (r) =>
		(r._measurement == "netdata.users.cpu.influxdb"))
	|> filter(fn: (r) =>
		(r.host == "vpsfrsqlpac1"))

data
	|> aggregateWindow(fn: mean, every: 5m)
	|> to(bucket: "history", org: "sqlpac")
The task is created through the graphical user interface or in command lines with influx task:
influxdb% export INFLUX_ORG=sqlpac
influxdb% influx task create @$SCRIPTS/@task_influxdb1_cpu.flux
Tasks logs are available in command line :
influxdb% export INFLUX_ORG=sqlpac influxdb% influx task findID Name OrganizationID Organization AuthorizationID Status Every Cron 053db5267712f000 task_influxdb1_cpu e71686ff910f3f32 sqlpac <nil> active 5minfluxdb% influx task log find --task-id 053db5267712f000RunID Time Message 053db789b812f000 2020-02-14T18:25:00.017404174Z Started task from script: "option task = {name: \"task_influxdb1_cpu\", every: 5m}\n\ndata = from(bucket: \"netdatatsdb\")\n\t|> range(start: -duration(v: int(v: task.every) * 2))\n\t|> filter(fn: (r) =>\n\t\t(r._measurement == \"netdata.users.cpu.influxdb\"))\n\t|> filter(fn: (r) =>\n\t\t(r.host == \"vpsfrsqlpac1\"))\n\ndata\n\t|> aggregateWindow(fn: mean, every: 5m)\n\t|> to(bucket: \"history\", org: \"sqlpac\")" 053db789b812f000 2020-02-14T18:25:00.151736449Z Completed(success) 053db664c012f000 2020-02-14T18:20:00.015766176Z Started task from script: "option task = {name: \"task_influxdb1_cpu\", every: 5m}\n\ndata = from(bucket: \"netdatatsdb\")\n\t|> range(start: -duration(v: int(v: task.every) * 2))\n\t|> filter(fn: (r) =>\n\t\t(r._measurement == \"netdata.users.cpu.influxdb\"))\n\t|> filter(fn: (r) =>\n\t\t(r.host == \"vpsfrsqlpac1\"))\n\ndata\n\t|> aggregateWindow(fn: mean, every: 5m)\n\t|> to(bucket: \"history\", org: \"sqlpac\")" 053db664c012f000 2020-02-14T18:20:00.168045054Z Completed(success) 053db54aaf52f000 2020-02-14T18:15:11.176279364Z Started task from script: "option task = {name: \"task_influxdb1_cpu\", every: 5m}\n\ndata = from(bucket: \"netdatatsdb\")\n\t|> range(start: -duration(v: int(v: task.every) * 2))\n\t|> filter(fn: (r) =>\n\t\t(r._measurement == \"mem\"))\n\t|> filter(fn: (r) =>\n\t\t(r.host == \"vpsfrsqlpac1\"))\n\ndata\n\t|> aggregateWindow(fn: mean, every: 5m)\n\t|> to(bucket: \"history\", org: \"sqlpac\")" 053db54aaf52f000 2020-02-14T18:15:11.203447377Z Completed(success)
Setting up HTTPS/SSL
HTTPS/SSL needs adjustments when self-signed certificates are used. Even for development purpose, we may wish to encrypt HTTP packets,
especially over the internet network, between the client and the InfluxDB Server. Public and private keys are already prepared,
but as a reminder, use openssl to quickly create self-signed certificates :
influxdb% openssl req -x509 -nodes -newkey rsa:2048 \
  -keyout <directory>/srvifx2.key \
  -out <directory>/srvifx2.crt \
  -days 365
The public certificate (srvifx2.crt) is imported in the "Trusted Root Certification Authorities" certificate client store.
Add the public and private certificates in the command line starting the InfluxDB Server with the options --tls-key and
--tls-cert.
influxdb% nohup influxd  --bolt-path=/sqlpac/influxdb/${IFXSRVNAME}/srvifx2.bolt \
                   --engine-path=/sqlpac/influxdb/${IFXSRVNAME} \
                   --http-bind-address="vpsfrsqlpac2:9999" \
                   --tls-key=/var/ssl/VPSFRSQLPAC2.key \
                   --tls-cert=/var/ssl/VPSFRSQLPAC2.crt >> $LOG/srvifx2.log 2>&1 &
The HTTPS protocol is notified in the server log file :
ts=2020-02-12T12:20:03.115534Z lvl=info msg=Listening log_id=0Kvw4gil000 transport=https addr=vpsfrsqlpac2:9999 port=9999HTTPS is enabled for the visualization tool : https://vpsfrsqlpac2:9999, but now the client tool influx is rejected :
influxdb% influx user findClient sent an HTTP request to an HTTPS server
The environment variable INFLUX_HOST must be updated to https :
influxdb% export INFLUX_HOST=https://vpsfrsqlpac2:9999But it is still not enough when using a self-signed certificate :
influxdb% influx user findError: Get https://vpsfrsqlpac2:9999/api/v2/setup: x509: certificate signed by unknown authority.
The option --skip-verify must be added.
influxdb% influx --skip-verify user findAn alias can be defined when sourcing the InfluxDB server environment, it will avoid to repeat the option --skip-verify.
influxdb% alias i="influx --skip-verify"This kind of issue also occurs for telegraf plugins :
2020-02-12T14:13:50Z E! [outputs.influxdb_v2] when writing to [http://vpsfrsqlpac2:9999]:
Post http://vpsfrsqlpac2:9999/api/v2/write?bucket=netdatatsdb&org=sqlpac: write tcp 10.xx.xxx.xxx:46314->10.xx.xxx.xxx:9999: write: broken pipe

2020-02-12T14:17:38Z E! [outputs.influxdb_v2] when writing to [https://vpsfrsqlpac2:9999]:
Post https://vpsfrsqlpac2:9999/api/v2/write?bucket=netdatatsdb&org=sqlpac: x509: certificate signed by unknown authority
Update the telegraf agent configuration accordingly to https and set the option insecure_skip_verify to true :
tgfagent_netdata.conf
[[outputs.influxdb_v2]]
  urls = ["https://vpsfrsqlpac2:9999"]

  insecure_skip_verify = true
Telegraf - Parallel runs
Native supports for the protocols OpenTSDB, Graphite, Prometheus, CollectD, UDP are removed in version 2.
A telegraf agent must be setup between the application and the InfluxDB v2 server to manage these architectures.
Use case
Here is a use case : Netdata sends its metrics through the protocol OpenTSDB to an InfluxDB Server version 1.7 / port 4242
netdata.conf
[backend]
        # host tags =
        enabled = yes
        data source = average
        type = opentsdb
        destination = tcp:vpsfrsqlpac2:4242
        prefix = netdata
        hostname = vpsfrsqlpac1
        update every = 10
        buffer on failures = 10
        timeout ms = 20000
Metrics are sent with the following OpenTSDB syntax :
put netdata.users.sockets.daemon 1579463790 0.0000000 host=vpsfrsqlpac1Unfortunately, Telegraf does not have any OpenTSDB input plugin, only an output one, bad news…
But Netdata can also send its metrics through
the graphite protocol and Telegraf supports the Graphite data format through the input plugin socket_listener.
The target architecture will then be the following :
- Netdata sends its metrics in the graphite format to Telegraf agent listening on port 14001.
- Telegraf pushes the metrics both to InfluxDB v1.7 and InfluxDB v2 servers, let’s manage a parallel run as it is technically possible.
Version Telegraf 1.9 and onwards is required for InfluxDB v2.
Installation and configuration
Download and install Telegraf
influxdb% cd /opt/influxdata
influxdb% wget https://dl.influxdata.com/telegraf/releases/telegraf-1.13.3_linux_amd64.tar.gz
influxdb% tar xzvf telegraf-1.13.3_linux_amd64.tar.gz

influxdb% export PATH=/opt/influxdata/telegraf/usr/bin:$PATH
influxdb% export TGF_CFG=/opt/influxdata/dba/telegraf/cfg
influxdb% export TGF_LOG=/opt/influxdata/dba/telegraf/log
The Telegraf agent configuration file (tgf_netdata.conf) will be installed
in the directory $TGF_CFG defined above.
To generate the configuration file :
- Input plugin :
socket_listener - Output plugins : InfluxDB v1 and InfluxDB v2
influxdb:influxdb_v2
telegraf --input-filter socket_listener --output-filter influxdb:influxdb_v2 config > $TGF_CFG/tgf_netdata.confIn the general configuration, the parameter omit_hostname is set to true, otherwise the tag host
is automatically added by the telegraf agent and it overrides the tag host sent by NetData.
[agent]
  omit_hostname = true
The input plugin is configured : port 14001 and graphite data format.
[[inputs.socket_listener]]
  service_address = "tcp://:14001"
  data_format = "graphite"

  templates = [
        "measurement.host.measurement*"
  ]
A template is applied. Indeed when NetData sends its data with the graphite format, the format is the following :
netdata.vpsfrsqlpac1.users.cpu.postgres 0.0000000 1579463970But we want the host name to be a tag key (host=vpsfrsqlpac1) and not defined in the measurement name :
netdata.users.cpu.postgres,host=vpsfrsqlpac1 0.0000000 1579463970The template below applies this transformation :
  // Transform netdata.host.endofmeasurename value timestamp => netdata.endofmeasurement,host=xxxxx value timestamp
  templates = [
        "measurement.host.measurement*"
  ]
In the output configuration to InfluxDB Server 1.7, in this use case, https is not implemented
and the account influxdb connects to the server, no login credentials are required.
[[outputs.influxdb]]
  urls = ["http://vpsfrsqlpac1:8086"]
  database = "netdatatsdb"
  skip_database_creation = true
In the output configuration to InfluxDB Server 2, https is implemented so the option
insecure_skip_verify is set to true. The url, token, organization and bucket are specified.
[[outputs.influxdb_v2]]
 urls = ["https://vpsfrsqlpac2:9999"]
 token = "8onYTPhtWbn7F4543PkgtBRIQE62YBK9o9QRqIm3n8SawmQ_l8yXTWwwdfkeZ-K-Rso1Ab1H_nrlhaXt9ZRDeg=="
 organization = "sqlpac"
 bucket = "netdatatsdb"
 insecure_skip_verify = true
The token is the token generated for the user telegraf, user created in the InfluxDB Server v2 with the rights
read/write on the organization buckets :
influxdb% export INFLUX_HOST=https://vpsfrsqlpac2:9999
influxdb% export INFLUX_ORG=sqlpac
influxdb% alias i="influx --skip-verify"

influxdb% i user create --name telegraf --password "***************"
influxdb% i auth create --user telegraf --read-buckets --write-buckets
Running Telegraf
The Netdata configuration is therefore set to graphite data format to port 14001 of the Telegraf Agent and NetData is restarted :
[backend]
        enabled = yes
        data source = average
        type = graphite
        destination = tcp:vpsfrsqlpac2:14001
        prefix = netdata
        hostname=vpsfrsqlpac1
        update every = 10
        buffer on failures = 10
        timeout ms = 20000
To run the Telegraf Agent (in debug mode below to check it is the right configuration) :
influxdb% nohup telegraf --config $TGF_CFG/tgf_netdata.conf \
                   --debug >> $TGF_LOG/tgf_netdata.log 2>&1 &
When output streams are properly defined :
2020-02-14T17:44:17Z I! Starting Telegraf 1.13.3
2020-02-14T17:44:17Z I! Loaded inputs: socket_listener
2020-02-14T17:44:17Z I! Loaded aggregators:
2020-02-14T17:44:17Z I! Loaded processors:
2020-02-14T17:44:17Z I! Loaded outputs: influxdb influxdb_v2
2020-02-14T17:44:17Z I! Tags enabled:
2020-02-14T17:44:17Z I! [agent] Config: Interval:10s, Quiet:false, Hostname:"", Flush Interval:10s
2020-02-14T17:44:17Z D! [agent] Initializing plugins
2020-02-14T17:44:17Z D! [agent] Connecting outputs
2020-02-14T17:44:17Z D! [agent] Attempting connection to [outputs.influxdb]
2020-02-14T17:44:17Z D! [agent] Successfully connected to outputs.influxdb
2020-02-14T17:44:17Z D! [agent] Attempting connection to [outputs.influxdb_v2]
2020-02-14T17:44:17Z D! [agent] Successfully connected to outputs.influxdb_v2
2020-02-14T17:44:17Z D! [agent] Starting service inputs
2020-02-14T17:44:17Z I! [inputs.socket_listener] Listening on tcp://[::]:14001
2020-02-14T17:44:20Z D! [outputs.influxdb_v2] Wrote batch of 1000 metrics in 44.85221ms
2020-02-14T17:44:20Z D! [outputs.influxdb_v2] Buffer fullness: 1979 / 10000 metrics
2020-02-14T17:44:20Z D! [outputs.influxdb] Wrote batch of 1000 metrics in 57.396782ms
2020-02-14T17:44:20Z D! [outputs.influxdb] Buffer fullness: 1979 / 10000 metrics
A parallel run is now implemented, just need now to define Telegraf Agent as a service.
InfluxDB v2 and reporting with Grafana
A plugin for Flux (InfluxDB Flux Datasource), still in beta version, is available. It requires Grafana 6.5 and onwards. To install it :
grafana% grafana-cli --pluginsDir ~/grafana-6.6.1/data/plugins plugins install grafana-influxdb-flux-datasourceRestart Grafana server.
Create a user grafana in the InfluxDB server with the appropriate rights, at least read only on bucket(s) :
influxdb% export INFLUX_HOST=https://vpsfrsqlpac2:9999
influxdb% export INFLUX_ORG=sqlpac
influxdb% alias i="influx --skip-verify"

influxdb% i user create --name grafana --password "***************"
influxdb% i auth create --user grafana --read-buckets
In Grafana, create a datasource using the plugin "Flux (InfluxDB) [BETA]"
- Set the option "Skip TLS verify" to "
on" when using HTTPS/SSL. - Fill the organization and the default bucket
- Fill the field "Token" with the token created when defining the authentication above.
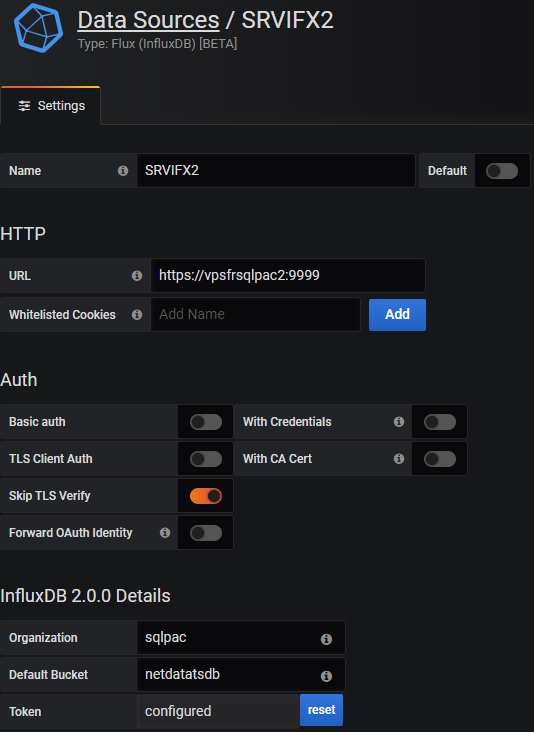
It works, but disappointing for the moment, we must wait, the plugin is still in beta phase and the UI explorer is not yet implemented to avoid writing the Flux syntax.
When the UI explorer is released, everything should be ready without having to write the Flux syntax as it is with the plugin for InfluxQL / InfluxDB v1. Migrating existing InfluxDB v1.x InfluxQL dashboards will surely imply exports/imports in JSON format (datasources, queries translations from InfluxQL to Flux…).
Conclusion
There are many new exciting features with InfluxDB v2 : joins, pivot, external data sources in the Flux language, but a non neglictible work is expected for migrating :
- the Continuous queries to Flux tasks
- the existing feeds using the native protocols OpenTDS/Graphite… to Telegraf
- the Grafana Dashboards to Flux language
That’s the problem with a new major version including a refactoring : breaks requiring code rewrites, features that become deprecated. The reasons why sometimes other products are then investigated. The break generated with the Flux language is important, but after crossing the barrier of learning the Flux language, this language offers very interesting procedural features and removes all the limitations that the InfluxQL language had.