
Introduction
When installing NetData, a powerful monitoring tool, a question is quickly asked : where to keep and store measures ?
NetData enables to store the measures in an InfluxDB database, a time series database, through the protocol OpenTSDB (Open TimeSeries Database protocol).
InfluxDB is a high performance database with efficient compression, entirely written in Go it has no external dependencies. InfluxDB can be easily interfaced to Grafana for reporting purposes. InfluxQL is the query language for working with data in InfluxDB databases and starting version 1.7, the language Flux is also introduced and can be enabled : Flux will be the language in the next major version of InfluxDB, but unfortunately the latter one is very different from SQL language.
Let’s see the InfluxDB architecture and how to use it.
Architecture
Terminology : measurements, series, keys, values
Databases store measurements. In the example below, 2 measurements : netdata.users.mem.root and
netdata.users.cpu.root.
- If measurement does not exist while inserting the data, the measurement is created.
- Time is in Epoch time (nanoseconds) :
1580940454000000000↔02/05/2020 @ 10:07pm (UTC). Without programming languages, many converter tools exist.
- Tag keys can be defined in a line. In the example above, 1 tag key :
host - One or multiple values field keys can be defined in a line. In the example above, 1 field key :
value - Series are the combination measurement/possible tag keys:
In the above measurementmeasurement, tag key1=value1, tag key2=value2 [,...]netdata.users.cpu.root, 2 series :netdata.users.cpu.root,host=vpsfrsqlpac1 netdata.users.cpu.root,host=vpsfrsqlpac2
InfluxDB Line protocol
InfluxDB line protocol is a text based format for writing points to InfluxDB. Its format is very simple :
With the client influx, let’s create points in the netdatatsdb database :
influxdb% influx -database 'netdatatsdb'> insert cpu_measurement,location=france,host=vpsfrsqlpac1 value=25.089878,description="low usage" 1580918550000000000 > insert cpu_measurement,location=germany,host=vpsfrsqlpac2 value=75.089878,description="high usage" 1580918550000000000 > select * from cpu_measurement;time description host location value ---- ----------- ---- -------- ----- 1580918550000000000 high usage vpsfrsqlpac2 germany 75.089878 1580918550000000000 low usage vpsfrsqlpac1 france 25.089878
When the timestamp is omitted, InfluxDB uses the server’s local nanosecond timestamp in UTC.
Tags or fields ? General recommendations
Tags are indexed and fields are not indexed. The queries should guide what gets stored as a tag and what gets stored as a field.
- Store data in tags if they are metadata or if you plan to use them in
GROUP BYclauses. - Important : tag values are always interpreted as strings. So fields must be used if we need them to be something other than a string.
- Store data in fields if they are used with SQL functions(
SUM,COUNT…). - Don’t use the same name for a tag and a field.
- Don’t encode data in measurements names and tag values as far as possible, this will avoid using regular expressions. For
example use
plot=1,region=northinstead oflocation=plot-1.northto avoid the following regular expression in the queries :SELECT … FROM <measurement> WHERE location =~ /\.north$/
Databases, retention policies and shards
A retention policy is defined for a database, this one can be infinite, it is the default retention policy (autogen). InfluxDB
stores data in shard groups. Shard groups are organized by retention policy and store data with timestamps that fall a specific time interval called
the shard duration.
Shard groups durations can be user defined, otherwise the below default values are applied :
| Retention policy duration | Shard group duration |
< 2 days
>= 2 days and <= 6 months
> 6 months |
1 hour
1 day
7 days |
The default shard group durations work well for most cases. However, high-throughput or long-running instances will benefit from using longer shard group durations. Recommendations :
| Retention policy duration | Shard group duration |
<= 1 day
> 1 day and <= 7 days
> 7 days and <= 3 months
> 3 months
infinite |
6 hours
1 day
7 days
30 days
52 weeks or longer |
In Memory indexing and Time-Structured Merge Tree (TSM)
In version 1.7, the default storage engine is the "In Memory Index" one. A new storage is available (TSI : Time Series Index) but it is not activated by default, this storage engine is addressed in the next paragraph.
Each database has its own WAL (Write Ahead Log) and TSM files.
- WAL segments store compressed blocks of writes and deletes.
- TSM files store compressed series data in columnar format.
- The cache is an in-memory representation of the data stored in the WAL. It is queried at runtime and merged with the data stored in the TSM files.
- The In-Memory index is a shared index across shards that provides quick access to measurements, tags and series.
Time Series Index (TSI)
Starting version 1.3, the TSI engine is released. It is still disabled by default, as a migration is necessary for existing databases.
The In memory indexing - TSM engine showed limitations for systems using millions of series and high cardinality : until TSI, the inverted index was an in-memory data structure built during startup of the database based on the data in TSM. Memory utilization continued increasing as new time series were created.
The new time series index (TSI) moves the index to files on disk, files are mapped to memory. In this context, the operating system handles the least recently used (LRU) memory. Background routines run constantly to compact the index into larger and larger files to avoid having to do too many index merges at query time.
Supported protocols
About data ingestion, InfluxDB supports the protocols below and multiple listeners can be defined :
- Collectd
- Graphite
- OpenTSDB
- Prometheus
- UDP
Starting InfluxDB version 2, actually in beta step (February 2020), these protocols won’t be natively supported anymore : telegraf will have to be used.
Installation
A debian package is available for Ubuntu but in this article, as it is a non-root installation, Linux 64 bits binaries version 1.7.9 are downloaded from InfluxDB Web Site.
Installation is done by the user influxdb in the directory /opt/influxdata.
influxdb% cd /opt/influxdata
influxdb% wget https://dl.influxdata.com/influxdb/releases/influxdb-1.7.9_linux_amd64.tar.gz
influxdb% tar xvfz influxdb-1.7.9_linux_amd64.tar.gz
The resulting directory structure is the following :
/opt/influxdata/influxdb-1.7.9-1
                            |___etc
                            |___usr
                            |___var
A symbolic link influxdb-1.7 is created for an ease of use and upgrades management.
influxdb% ln -fs influxdb-1.7.9-1 influxdb-1.7The environment variable $IFXHOME is set to the root installation directory and the variable $IFXBIN to the
directory where server and client binaries are located (influxd, influx…).
The directory $IFXBIN is added to the environment variable $PATH.
influxdb% export IFXHOME=/opt/influxdata/influxdb-1.7
influxdb% export IFXBIN=$IFXHOME/usr/bin
influxdb% export PATH=$IFXBIN:$PATH
3 custom environment variables, $CFG, $LOG and $RUN, are created for the log, configuration and pid files directories :
influxdb% export CFG=/opt/influxdata/dba/srvifxsqlpac/cfg
influxdb% export LOG=/opt/influxdata/dba/srvifxsqlpac/log
influxdb% export RUN=/opt/influxdata/dba/srvifxsqlpac/run
That’s all, no need to define other variables for librairies and so on…
Preparing the configuration file
A template configuration file influxdb.conf is available in the directory $IFXHOME/etc
Create the configuration file from the template file and customize the values for the databases location (meta, data, wal) :
$CFG/srvifxsqlpac.conf
[meta]
  dir = "/sqlpac/influxdb/srvifxsqlpac/meta"

[data]
  dir = "/sqlpac/influxdb/srvifxsqlpac/data"
  wal-dir = "/sqlpac/influxdb/srvifxsqlpac/wal"
If it is planned to use the language Flux, language that offers many new features (joins, pivot, external data sources access…), this one must be activated in the configuration file :
[http]
  flux-enabled = true
The default port is 8086 and can be modified in the configuration file :
[http]
  bind-address = ":8086"
Starting the server
To start the InfluxDB server, run influxd with the option -config giving the configuration file path :
nohup $IFXBIN/influxd -pidfile /tmp/srvifxsqlpac.pid -config $CFG/srvifxsqlpac.conf >> $LOG/srvifxsqlpac.log 2>&1 &The option -pidfile is used to easier manage the shutdown procedure.
Connection to the server
Run the client influx to connect and execute InfluxQL commands :
influxdb% influxConnected to http://localhost:8086 version 1.7.9 InfluxDB shell version: 1.7.9> SHOW DATABASES;name: databases name ---- _internal
Stopping the server
To stop the server :
influxdb% kill -s TERM <processid influxd> influxdb% PIDFILE=$(cat $RUN/srvifxsqlpac.pid)
influxdb% kill -s TERM $PIDFILEManaging databases, retention policies and shards
Creating a database
Easy : just run CREATE DATABASE
influxdb% influx> CREATE DATABASE netdatatsdb;
If the parameter retention-autocreate is not set to false in the configuration file,
the default retention policy autogen set to infinite is activated in the database :
USE netdatatsdb; SHOW RETENTION POLICIES;name duration shardGroupDuration replicaN default ---- -------- ------------------ -------- ------- autogen 0s 168h0m0s 1 true
Replication is set to 1. Replication is available only in the Enterprise Edition.
As the retention is infinite, the default shard group duration applied is 7 days (168 hours). The command SHOW SHARDS
gives more details about the existing shards :
SHOW SHARDS;id database retention_policy shard_group start_time end_time expiry_time owners -- -------- ---------------- ----------- ---------- -------- ----------- ------ 15 netdatatsdb autogen 15 2019-12-23T00:00:00Z 2019-12-30T00:00:00Z 2019-12-30T00:00:00Z 22 netdatatsdb autogen 22 2020-01-06T00:00:00Z 2020-01-13T00:00:00Z 2020-01-13T00:00:00Z 26 netdatatsdb autogen 26 2020-01-13T00:00:00Z 2020-01-20T00:00:00Z 2020-01-20T00:00:00Z 47 netdatatsdb autogen 47 2020-01-20T00:00:00Z 2020-01-27T00:00:00Z 2020-01-27T00:00:00Z 58 netdatatsdb autogen 58 2020-02-03T00:00:00Z 2020-02-10T00:00:00Z 2020-02-10T00:00:00Z
Retention policies and shards
A retention policy autogen is created and predefined, obviously it can be modified creating or altering policies
CREATE RETENTION POLICY retention_infinite ON telegraf
DURATION inf REPLICATION 1 SHARD DURATION 52w DEFAULT;
USE telegraf; SHOW RETENTION POLICIES;name duration shardGroupDuration replicaN default ---- -------- ------------------ -------- ------- autogen 0s 168h0m0s 1 false retention_infinite 0s 8736h0m0s 1 true
The clause REPLICATION is mandatory in the CREATE statement even if the community OSS edition is used.
ALTER RETENTION POLICY autogen ON netdatatsdb SHARD DURATION 52w; ALTER RETENTION POLICY autogen ON netdatatsdb DEFAULT; USE netdatatsdb; SHOW RETENTION POLICIES;name duration shardGroupDuration replicaN default ---- -------- ------------------ -------- ------- autogen 0s 8736h0m0s 1 true
About shards, the engine manages the pre-creation. The precreation can be controlled in the configuration file.
[shard-precreation]
  # Determines whether shard pre-creation service is enabled.
  enabled = true
  # The interval of time when the check to pre-create new shards runs.
  check-interval = "10m"
  # The default period ahead of the endtime of a shard group that its successor group is created.
  advance-period = "30m"
Querying and writing data
Metadata informations : measurements, series, tag and field keys
The command SHOW displays useful informations about metadata : measurements, series, tag keys, field keys…
Use SHOW MEASUREMENTS to list the measurements, regular expressions can be used :
SHOW MEASUREMENTS;… netdata.users.vmem.alerta netdata.users.vmem.apache netdata.users.vmem.daemon …
SHOW MEASUREMENTS WITH MEASUREMENT =~ /dbengines/;… netdata.dbengines.cpu.influxd netdata.dbengines.cpu.mysqld netdata.dbengines.cpu.postgres …
To list the series, SHOW SERIES :
SHOW SERIES;… netdata.users.vmem.mcs,host=vpsfrsqlpac1 netdata.users.vmem.mcs,host=vpsfrsqlpac2 netdata.users.vmem.messagebus,host=vpsfrsqlpac1 netdata.users.vmem.messagebus,host=vpsfrsqlpac2 netdata.users.vmem.mongodb,host=vpsfrsqlpac1 …
SHOW SERIES FROM "netdata.users.cpu.postgres";key --- netdata.users.cpu.postgres,host=vpsfrsqlpac1 netdata.users.cpu.postgres,host=vpsfrsqlpac2
SHOW SERIES FROM "netdata.users.cpu.postgres" WHERE host = 'vpsfrsqlpac1';key --- netdata.users.cpu.postgres,host=vpsfrsqlpac1
SHOW SERIES FROM "netdata.users.cpu.postgres" WHERE host !~ /vpsfrsqlpac1/;key --- netdata.users.cpu.postgres,host=vpsfrsqlpac2
Tag and field keys can be also listed with SHOW commands, including the distinct values from tag keys :
SHOW TAG KEYS FROM "cpu_measurement";name: cpu_measurement tagKey ------ host location
SHOW TAG VALUES FROM "cpu_measurement" WITH KEY=location;name: cpu_measurement key value --- ----- location france location germany
SHOW FIELD KEYS FROM "cpu_measurement";name: cpu_measurement fieldKey fieldType -------- --------- description string value float
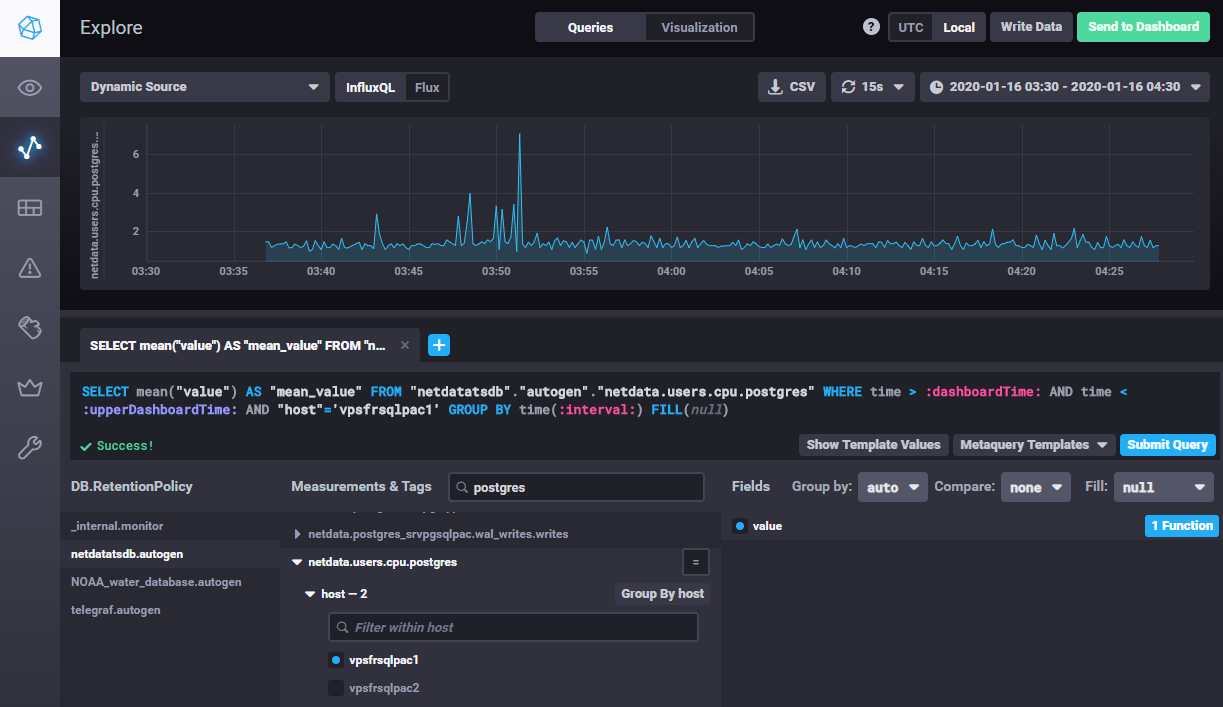
Queries
Specify the precision rfc3339 to convert the Unix timestamps to human-readable time.
PRECISION rfc3339SELECT MEAN(value) AS mean_value FROM "netdata.users.cpu.postgres" WHERE time > '2020-01-16T02:30:00.000Z' AND time < '2020-01-16T03:30:00.000Z' AND host = 'vpsfrsqlpac1' GROUP BY time(10s)name: netdata.users.cpu.postgres time mean_value ---- ---------- 2020-01-16T02:41:10Z 1.68414 2020-01-16T02:41:20Z 1.19909 2020-01-16T02:41:30Z 1.17531
Subqueries are allowed.
Numerous InfluxQL functions are available.
Writing data
Enforcing data types
Let’s write a point :
INSERT cpu_measurement,location=france,host=vpsfrsqlpac1 cpupct=32.887384,slot=1 SELECT * FROM cpu_measurementname: cpu_measurement time cpupct host location slot ---- ------ ---- -------- ---- 1581037980496337504 32.887384 vpsfrsqlpac1 france 1
The column type is automatically defined when inserting the first point :
SHOW FIELD KEYS FROM cpu_measurementname: cpu_measurement fieldKey fieldType -------- --------- cpupct float slot float
The datatype of the column slot has been automatically defined to float.
If you want to set the exact datatype : data type integer for the column slot,
add i after the value when inserting the first point. For boolean data types,
be sure to write true or false without quotes or double quotes:
INSERT cpu_measurement,location=france,host=vpsfrsqlpac1 cpupct=32.887384,slot=1i,active=true SHOW FIELD KEYS FROM cpu_measurementname: cpu_measurement fieldKey fieldType -------- --------- active boolean cpupct float slot integer
Setting the right data type reduces memory and space consumptions and it enforces data integrity : wrong values will be rejected
INSERT cpu_measurement,location=france,host=vpsfrsqlpac1 cpupct=32.887384,slot=1.121212ERR: {"error":"partial write: field type conflict: input field \"slot\" on measurement \"cpu_measurement\" is type float, already exists as type integer dropped=1"}
Bulk import
Bulk import is very easy, just create a file with the header containing DDL/DML CONTEXT-DATABASE clauses and then the
lines in InfluxDB Line protocol:
prices.txt
# DDL
CREATE DATABASE finance

# DML
# CONTEXT-DATABASE: finance

prices,type=NSDQ open=10.62,high=10.82,low=10.62,clot=10.65,capit=3.09 1580918400
prices,type=NSDQ open=10.65,high=10.95,low=10.64,clot=10.59,capit=3.09 1581004800
The database can already exists, otherwise it is created. The DML specifies which database to use.
The client influx is executed to import :
influxdb% influx -import -path=prices.txt -precision=s2020/02/07 13:12:53 Processed 1 commands 2020/02/07 13:12:53 Processed 1249 inserts 2020/02/07 13:12:53 Failed 0 inserts
influxdb% influx -database finance -precision rfc3339select * from prices limit 2name: prices time capit clot high low open type ---- ----- ---- ---- --- ---- ---- 2020-02-05T16:00:00Z 3.09 10.65 10.82 10.62 10.62 NSDQ 2020-02-06T16:00:00Z 3.09 10.59 10.95 10.64 10.65 NSDQ
SELECT INTO
Data and queries results can be copied, even in a cross database context, with the SELECT INTO statement.
USE finance; SELECT * INTO mydb..prices from prices;name: result time written ---- ------- 0 2
Continuous queries can automate SELECT INTO statements in order to compute/aggregate results and so on… But
this functionality is not covered here in this introduction, it is a chapter apart, there are many things to point out.
Listeners and data ingestion
InfluxDB 1.x supports natively the protocols below for data ingestion :
- Graphite
- OpenTDS
- CollectD
- Prometheus
- UDP
With InfluxDB V2, it will not be possible anymore, telegraf will be mandatory for feeding the InfluxDB database through these protocols.
Just one example here : Netdata sends its metrics with the protocol OpenTDS, so an OpenTDS listener (port 4242) is defined in the InfluxDB server configuration file. A database is attached to the listener, it will be created if it does not exist. Multiple listeners can be defined.
$CFG/srvifxsqlpac.conf
[[opentsdb]]
  enabled = true
  bind-address = ":4242"
  database = "netdatatsdb"
The InfluxDB server OpenTDS port is specified in the Netdata configuration file :
netdata.conf
[backend]
        # host tags =
        enabled = yes
        data source = average
        type = opentsdb
        destination = tcp:vpsfrsqlpac1:4242
        prefix = netdata
        update every = 10
        buffer on failures = 10
        timeout ms = 20000
Visualizing data
Chronograf
A visualization tool is available for download : Chronograf. The installation is very easy.
influxdb% cd /opt/influxdata
influxdb% wget https://dl.influxdata.com/chronograf/releases/chronograf-1.7.16_linux_arm64.tar.gz
influxdb% tar xvfz  chronograf-1.7.16_linux_arm64.tar.gz

influxdb% ln -fs chronograf-1.7.16-1 chronograf-1.7
To start Chronograf on port 8087 :
influxdb% cd /opt/influxdata influxdb% nohup ./chronograf-1.7/usr/bin/chronograf --port 8087 --influxdb-url=http://vpsfrsqlpac1:8086 \ --bolt-path $CFG/chronograf/chronograf.db >> /dev/null 2>> $LOG/chronograf.log &time="2020-02-06T15:06:51+01:00" level=info msg="Serving chronograf at http://[::]:8087" component=server
The bolt database (--bolt-path), created when running Chronograf for the first time, store dashboards definitions…
The tool is very easy to use and intuitive.
Starting InfluxDB version 1.7.x and if the language Flux is enabled
in the configuration file (flux-enabled = true), both InfluxQL and Flux languages are available in Chronograf : menu buttons allow to switch from one
to another. This functionality will be helpful when preparing the migration to InfluxDB v2, InfluxQL will be indeed removed in this version and Flux
will be the unique language.
Further notice : starting version 2.0, Chronograf functionalities are fully integrated in InfluxDB, it will not be anymore a separate standalone tool.
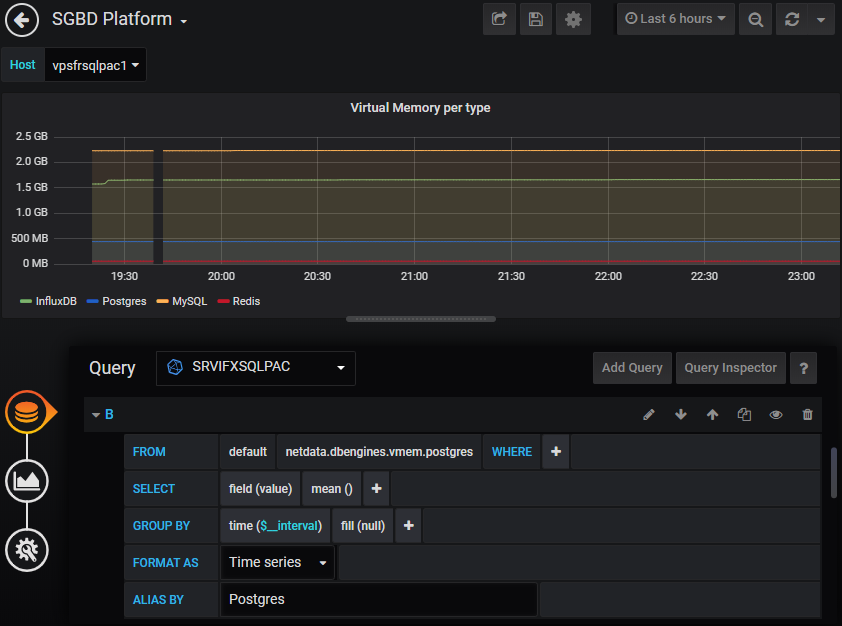
Grafana
Grafana easily integrates dashboards with InfluxDB as a data source. In the menu, select ConfigurationData Sources, click the
button "Add Data Source" and then choose "InfluxDB". Fill the datasource connection informations
(http://<hostname>:<port InfluxDB>…) and that’s all, then building dashboards is very intuitive.
The plugin for the Flux language is in beta phase but available : Flux (InfluxDB) DataSource plugin. It requires Grafana 6.4 and onwards versions.
Statistics and configuration
Use the command SHOW STATS to consult statistics. Without arguments, all statistics are displayed, except the in
memory index size.
In Memory index size
SHOW STATS FOR 'indexes'name: indexes memoryBytes ----------- 5438060
Statistics per database
SHOW STATS FOR 'database'name: database tags: database=_internal numMeasurements numSeries --------------- --------- 13 147 name: database tags: database=netdatatsdb numMeasurements numSeries --------------- --------- 2727 4441
Getting database size is not trivial, one can use SHOW STATS FOR 'shard' but the output is not easy,
shards are not ordered by database name :
SHOW STATS FOR 'shard';name: shard tags: database=netdatatsdb, engine=tsm1, id=15, indexType=inmem, path=/sqlpac/influxdb/srvifxsqlpac/data/netdatatsdb/autogen/15, retentionPolicy=autogen, walPath=/sqlpac/influxdb/srvifxsqlpac/wal/netdatatsdb/autogen/15 diskBytes fieldsCreate seriesCreate writeBytes writePointsDropped writePointsErr writePointsOk writeReq writeReqErr writeReqOk --------- ------------ ------------ ---------- ------------------ -------------- ------------- -------- ----------- ---------- 36094696 0 2973 0 0 0 0 0 0 0 name: shard tags: database=netdatatsdb, engine=tsm1, id=22, indexType=inmem, path=/sqlpac/influxdb/srvifxsqlpac/data/netdatatsdb/autogen/22, retentionPolicy=autogen, walPath=/sqlpac/influxdb/srvifxsqlpac/wal/netdatatsdb/autogen/22 diskBytes fieldsCreate seriesCreate writeBytes writePointsDropped writePointsErr writePointsOk writeReq writeReqErr writeReqOk --------- ------------ ------------ ---------- ------------------ -------------- ------------- -------- ----------- ---------- 17649537 0 3422 0 0 0 0 0 0 0 name: shard tags: database=netdatatsdb, engine=tsm1, id=26, indexType=inmem, path=/sqlpac/influxdb/srvifxsqlpac/data/netdatatsdb/autogen/26, retentionPolicy=autogen, walPath=/sqlpac/influxdb/srvifxsqlpac/wal/netdatatsdb/autogen/26 diskBytes fieldsCreate seriesCreate writeBytes writePointsDropped writePointsErr writePointsOk writeReq writeReqErr writeReqOk --------- ------------ ------------ ---------- ------------------ -------------- ------------- -------- ----------- ---------- 110735177 0 3691 0 0 0 0 0 0 0 name: shard tags: database=netdatatsdb, engine=tsm1, id=47, indexType=inmem, path=/sqlpac/influxdb/srvifxsqlpac/data/netdatatsdb/autogen/47, retentionPolicy=autogen, walPath=/sqlpac/influxdb/srvifxsqlpac/wal/netdatatsdb/autogen/47 diskBytes fieldsCreate seriesCreate writeBytes writePointsDropped writePointsErr writePointsOk writeReq writeReqErr writeReqOk --------- ------------ ------------ ---------- ------------------ -------------- ------------- -------- ----------- ---------- 28286352 0 3577 0 0 0 0 0 0 0 name: shard tags: database=netdatatsdb, engine=tsm1, id=58, indexType=inmem, path=/sqlpac/influxdb/srvifxsqlpac/data/netdatatsdb/autogen/58, retentionPolicy=autogen, walPath=/sqlpac/influxdb/srvifxsqlpac/wal/netdatatsdb/autogen/58 diskBytes fieldsCreate seriesCreate writeBytes writePointsDropped writePointsErr writePointsOk writeReq writeReqErr writeReqOk --------- ------------ ------------ ---------- ------------------ -------------- ------------- -------- ----------- ---------- 46062999 234 3294 0 0 0 5699051 7092 0 7092
Or a query can be issued directly in the database _internal to filter the database name.
USE _internal; SELECT last("diskBytes") FROM "monitor"."shard" WHERE ("database" =~/netdatatsdb/) AND time >= now() -1m GROUP BY "database", "path" fill(null);name: shard tags: database=netdatatsdb, path=/sqlpac/influxdb/srvifxsqlpac/data/netdatatsdb/autogen/15 time last ---- ---- 1581030800000000000 36094696 name: shard tags: database=netdatatsdb, path=/sqlpac/influxdb/srvifxsqlpac/data/netdatatsdb/autogen/22 time last ---- ---- 1581030800000000000 17649537 name: shard tags: database=netdatatsdb, path=/sqlpac/influxdb/srvifxsqlpac/data/netdatatsdb/autogen/26 time last ---- ---- 1581030800000000000 110735177 name: shard tags: database=netdatatsdb, path=/sqlpac/influxdb/srvifxsqlpac/data/netdatatsdb/autogen/47 time last ---- ---- 1581030800000000000 28286352 name: shard tags: database=netdatatsdb, path=/sqlpac/influxdb/srvifxsqlpac/data/netdatatsdb/autogen/58 time last ---- ---- 1581030800000000000 44106795
Statistics per input plugins (listeners)
When listeners are setup for data ingestion (opentsdb, graphite, udp…), statistics per listener can be displayed : in the example below, opentsdb on port 4242 for data ingestion coming from netdata.
SHOW STATS for 'opentsdb';name: opentsdb tags: bind=:4242 batchesTx batchesTxFail connsActive connsHandled droppedPointsInvalid httpConnsHandled pointsTx tlBadFloat tlBadLine tlBadTag tlBadTime --------- ------------- ----------- ------------ -------------------- ---------------- -------- ---------- --------- -------- --------- 7542 0 1 1 0 0 6063674 0 0 0 0 tlBytesRx tlConnsActive tlConnsHandled tlPointsRx tlReadErr --------- ------------- -------------- ---------- --------- 462091571 1 1 6063674 0
Running queries
Unoptimized queries may have unexpected behaviours in the InfluxDB engine (CPU…), use SHOW QUERIES and KILL QUERY
to kill high consuming resources queries :
SHOW QUERIESqid query --- ----- 690 SELECT mean(value) AS mean_value FROM netdatatsdb.autogen."netdata.users.cpu.postgres" WHERE time > '1900-01-16T02:30:00.000Z' AND time < '2020-01-16T03:30:00.000Z' AND host = 'vpsfrsqlpac1' GROUP BY time(10s) database duration status -------- -------- ------ netdatatsdb 8m2s runningKILL QUERY 690;
Configuration
To view the current settings :
SHOW DIAGNOSTICS;name: build Branch Build Time Commit Version ------ ---------- ------ ------- 1.7 23bc63d43a8dc05f53afa46e3526ebb5578f3d88 1.7.9 name: config bind-address reporting-disabled ------------ ------------------ 127.0.0.1:8088 false name: config-coordinator log-queries-after max-concurrent-queries max-select-buckets max-select-point max-select-series query-timeout write-timeout ----------------- ---------------------- ------------------ ---------------- ----------------- ------------- ------------- 0s 0 0 0 0 0s 10s name: config-cqs enabled query-stats-enabled run-interval ------- ------------------- ------------ true false 1s name: config-data cache-max-memory-size cache-snapshot-memory-size cache-snapshot-write-cold-duration compact-full-write-cold-duration --------------------- -------------------------- ---------------------------------- -------------------------------- 1073741824 26214400 10m0s 4h0m0s dir max-concurrent-compactions max-index-log-file-size max-series-per-database max-values-per-tag series-id-set-cache-size --- -------------------------- ----------------------- ----------------------- ------------------ ------------------------ /sqlpac/influxdb/srvifxsqlpac/data 0 1048576 1000000 100000 100 wal-dir wal-fsync-delay ------- --------------- /sqlpac/influxdb/srvifxsqlpac/wal 0s name: config-httpd access-log-path bind-address enabled https-enabled max-connection-limit max-row-limit --------------- ------------ ------- ------------- -------------------- ------------- :8086 true false 0 0 name: config-meta dir --- /sqlpac/influxdb/srvifxsqlpac/meta name: config-monitor store-database store-enabled store-interval -------------- ------------- -------------- _internal true 10s name: config-opentsdb enabled bind-address database retention-policy batch-size batch-pending batch-timeout ------- ------------ -------- ---------------- ---------- ------------- ------------- true :4242 netdatatsdb 1000 5 1s name: config-precreator advance-period check-interval enabled -------------- -------------- ------- 30m0s 10m0s true name: config-retention check-interval enabled -------------- ------- 30m0s true name: config-subscriber enabled http-timeout write-buffer-size write-concurrency ------- ------------ ----------------- ----------------- true 30s 1000 40 name: network hostname -------- vpsfrsqlpac1 name: runtime GOARCH GOMAXPROCS GOOS version ------ ---------- ---- ------- amd64 2 linux go1.12.6 name: system PID currentTime started uptime --- ----------- ------- ------ 1382 2020-02-06T23:37:16.912800481Z 2020-02-06T18:20:27.149884796Z 5h16m49.762915685s
Conclusion
InfluxDB is a time series database with interesting performances and functionalities.
- Easy ingestion, natively or through common protocols (OpenTSDB, Graphite…).
- Queries SQL Like.
- Easy reporting and visualization with Grafana or Chronograf.
A useful functionality has not been covered in this introduction : the continuous queries. Too many things to point out.
Important note, actually in beta version (February 2020), InfluxDB v2 will be released soon and maybe the migration will not be so easy :
- The InfluxQL language is replaced by the Flux language in this release. Even if it contains interesting new features compared to InfluxQL (joins, pivots, access to external data…), the Flux language is more a no-SQL language not so obvious to learn.
- Native support for the protocols Graphite, OpenTSDB… is removed. The tool telegraf will be mandatory.
- Continuous queries are replaced by tasks.