
Introduction
Page speed is one of the key criteria in Google search engines ranking algorithms.
To perform audits on Web pages, an online tool using LightHouse is available on Google.com : PageSpeed Insights Online tool.
LightHouse is also available as an extension for Chrome, BUT, by the time you notice irrelevant results : incredible values for the statistics "Time to interactive", "Speed index", "First CPU idle", "Max Potential First Input Delay" compared to the user’s experience and feeling.
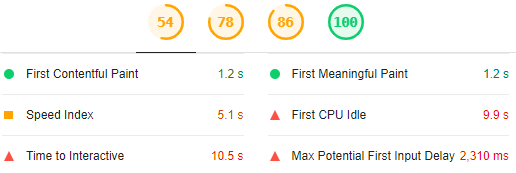
Statistics may be surprising especially if the hardware used does not suffer poor performances and they do not reflect the feeling.
Their incredible natures are confirmed by the results obtained by the online tool for the same page, more realistic and nearer to the user’s feeling :
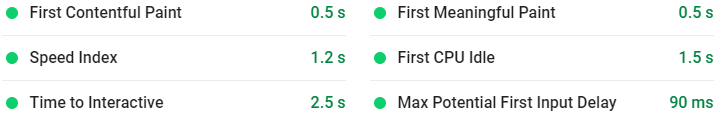
The extension for Chrome is great for auditing web pages needing huge enhancements, but not for fine tuning.
4 audit categories to focus on with LightHouse when analyzing and tuning web pages :
The API Google PageSpeed Insights (version 5 as of the writing this paper) gives the ability to retrieve programmatically page speed LightHouse results from Google labs.
With few Python code lines, the valuable statistics can be extracted and stored in a table for historization : useful when planning benchmarks before/after upgrades, updates.
September 2020 : Article updated with the new CLS (Cumulative Layout Shift) and LCP (Largest Contentful Paint) metrics introduced with LightHouse 6.
Getting page speed results with the package requests
Very few lines of code to retrieve the page speed results for a given URL, the GET method is used :
import requests

def run_pagespeed():

  request_url='https://www.sqlpac.com/referentiel/docs/influxdb-v1.7-architecture-installation-configuration-utilisation.html'
  apikey='ApIKeYYMNTHtvQ4…'
  serviceurl = 'https://www.googleapis.com/pagespeedonline/v5/runPagespeed'

  q = { 'url': request_url,
        'key': apikey ,
        'strategy': 'DESKTOP',
        'category':['PERFORMANCE','ACCESSIBILITY','BEST_PRACTICES','SEO'],
        'locale': 'fr' }

  rj = requests.get(serviceurl, params = q)

def main():
  run_pagespeed()

if (__name__=="__main__"):
    main()
Parameters description :
- The API key is optional : it is only needed if it is planned to automate the queries and make multiple queries per second.
- The strategy defines the device :
DESKTOPorMOBILE.'strategy': 'DESKTOP' - The Lighthouse categories to run. If none are given, only the performance category is computed.
Possible values :
PERFORMANCE,ACCESSIBILITY,BEST_PRACTICES,SEO,PWA(Progressive Web App). PWA is not discussed here.'category':['PERFORMANCE','ACCESSIBILITY','BEST_PRACTICES','SEO'] - The
localeparameter defines the output language for the results.'locale': 'fr'
Extracting metrics
The output is very verbose. Which data to extract and store ?
Preparing the objects
The results are first transformed to a dictionary object with the package json.
A dictionary named p is created to store the essential metrics to retrieve and save later in a table.
import json
…

rj = requests.get(serviceurl, params = q)

if (rj.status_code==200):
  fullresults = json.loads(rj.text)
  p = {}
Some metadata are prepared :
- Measure date time :
%Y-%m-%d %H:%M:%S - Results filename :
<page>_%Y%m%d%H%M%S.json. Results files will be stored in the directory$LOG. - Device (strategy) :
D | M, mobile or desktop
from datetime import datetime
…
        measuretime = datetime.now()
        p['date_measure'] = measuretime.strftime('%Y-%m-%d %H:%M:%S')
        p['resultfile'] = '%s_%s.json' % (q['url'].replace('.html','').split('/').pop(), measuretime.strftime('%Y%m%d%H%M%S'))
        p['device'] = 'D' if q['strategy'] == 'DESKTOP' else 'M'
The lighthouse results are stored in the key lighthouseResult in the JSON output :
"lighthouseResult": { }Results file is saved only if the key lighthouseResult exists :
        if (fullresults.get('lighthouseResult') != None):

          with open(os.getenv('LOG') + '/' + p['resultfile'],'w') as f:
            json.dump(fullresults,f,indent=4, ensure_ascii=False)

          r = fullresults.get('lighthouseResult')
An intermediate dictionary r containing the key lighthouseResult is created to alleviate
the source code.
Categories score
The score for each category is stored in r['categories'][category]['score']:
    "lighthouseResult": {
        …
        "categories": {
            "performance": {
                "id": "performance",
                "title": "Performance",
                "score": 0.84,
            …
            "accessibility": {
                "id": "accessibility",
                "title": "Accessibility",
                "description": "These…",
                "score": 0.87,
            …
            "best-practices": {
                "id": "best-practices",
                "title": "Best Practices",
                "score": 0.92,
            …
            "seo": {
                "id": "seo",
                "title": "SEO",
                "description": "These…",
                "score": 0.92,
            …
      …
    }
They are integrated in the dictionary p :
    if (fullresults.get('lighthouseResult') != None):
      r = fullresults.get('lighthouseResult')

      categories = ['performance', 'accessibility','best-practices','seo']

      for category in categories:
        try:
          p[category] = r['categories'][category]['score']*100
        except Exception:
           p[category] = 'null'
Essential metrics : First Content Full Paint, First CPU Idle…
The essential metrics are stored in the key r['audits']['metrics']['details']
In the example below, only the major relevant metrics we want to keep are displayed :
    "lighthouseResult": {
      …
      "audits": {
        …
            "metrics": {
                "id": "metrics",
                "title": "Metrics",
                "description": "Collects all available metrics.",

                "details": {
                    "type": "debugdata",
                    "items": [
                        {
                            "firstContentfulPaint": 601,
                            "firstMeaningfulPaint": 601,
                            "largestContentfulPaint": 1920,
                            "speedIndex": 1661,
                            "firstCPUIdle": 1137,
                            "interactive": 3522,
                            "estimatedInputLatency": 17,
                            "observedDomContentLoaded": 119,
                            "observedLoad": 223,
                            "totalBlockingTime": 39,
                            "cumulativeLayoutShift": 0.004959294866182179 …
                        }, …
]Metrics are in milliseconds, except cumulativeLayoutShift :
firstContentfulPaint: First Contentful Paint (FCP) marks the time at which the first text or image is painted.firstMeaningfulPaint: First Meaningful Paint measures when the primary content of a page is visible.largestContentfulPaint: new in LightHouse 6, "Largest Contentful Paint (LCP)" marks the point during page load when the primary content has loaded and is visible to the user, a measurement of perceived loading experience more realistic.speedIndex: Speed Index shows how quickly the contents of a page are visibly populated.firstCPUIdle: First CPU Idle marks the first time at which the page’s main thread is quiet enough to handle input.interactive: Time to interactive is the amount of time it takes for the page to become fully interactive.estimatedInputLatency: Estimated Input Latency is an estimate of how long the app takes to respond to user input, in milliseconds, during the busiest 5s window of page load. If the latency is higher than 50 ms, users may perceive the app as laggy.observedDomContentLoaded: Time duration before DOMContentLoaded event.observedLoad: Time duration before Load event.totalBlockingTime: Sum of all time periods between FCP and Time to Interactive, when task length exceeded 50ms, expressed in milliseconds.cumulativeLayoutShift: new in LightHouse 6, "Cumulative Layout Shift (CLS)" measures the visual stability and quantifies how much a page’s content visually shifts around.
To avoid hard coded metrics names in the program, a metadata JSON file speed-metadata.json is prepared to
specify the metrics we want to extract and store in the object p :
$CFG/speed-metadata.json
{
	"metrics" : 	[ "firstContentfulPaint","firstMeaningfulPaint","largestContentfulPaint",
					  "speedIndex","firstCPUIdle","interactive","estimatedInputLatency",
					  "observedDomContentLoaded","observedLoad",
					  "totalBlockingTime","cumulativeLayoutShift" ]
}Then in the program to feed the dictionary p:
      with open(os.getenv('CFG') + '/speed-metadata.json','r') as m:
        metadata = json.load(m)

      for s in metadata['metrics']:
        try:
          p[s] = r['audits']['metrics']['details']['items'][0][s]
        except Exception:
          p[s] = 'null'
Network requests, size, resources
The key r['audits']['diagnostics']['details'] gives a very useful overview about number of requests, bytes sizes, number of tasks, tasks time,
number of resources per type (stylesheets, scripts, fonts…).
In the example below, only the metrics we have chosen to keep and store are displayed and they have been ordered manually for the ease of read :
    "lighthouseResult": {
      …
      "audits": {
        …
          "diagnostics": {
          "id": "diagnostics",
          "title": "Diagnostics",
          "description": "Collection of useful page vitals.",

          "details": {
              "type": "debugdata",
              "items": [
                  {
                      "numRequests": 111,
                      "mainDocumentTransferSize": 14583,
                      "totalByteWeight": 540297,
                      "numTasks": 1350,
                      "numTasksOver10ms": 41,
                      "numTasksOver25ms": 17,
                      "numTasksOver50ms": 11,
                      "numTasksOver100ms": 2,
                      "numTasksOver500ms": 0,
                      "totalTaskTime": 1864.1690000000049,
                      "numFonts": 2,
                      "numScripts": 33,
                      "numStylesheets": 10,
                      "maxServerLatency": null
                  }
              ]
          }
The metrics meanings do not need comments, their names are explicit.
The metadata JSON file is enhanced to add the diagnostics metrics :
{
	"diagnostics" : [ "numRequests",
					  "mainDocumentTransferSize", "totalByteWeight",
                      "numTasks", "totalTaskTime",
					  "numTasksOver10ms", "numTasksOver25ms", "numTasksOver50ms", "numTasksOver100ms", "numTasksOver500ms",
                      "numFonts", "numScripts", "numStylesheets", "maxServerLatency" ]

	,"metrics" : 	[ "firstContentfulPaint","firstMeaningfulPaint","largestContentfulPaint",
					  "speedIndex","firstCPUIdle","interactive","estimatedInputLatency",
					  "observedDomContentLoaded","observedLoad",
					  "totalBlockingTime","cumulativeLayoutShift" ]
}The program becomes simpler :
      with open(os.getenv('CFG') + '/speed-metadata.json','r') as m:
        metadata = json.load(m)

      sections = ['metrics', 'diagnostics']
      for section in sections:
        for s in metadata[section]:
          try:
            p[s] = r['audits'][section]['details']['items'][0][s]
          except Exception:
            p[s] = 'null'
Max Potential First Input Delay
Unfortunately, the measure "Max Potential First Input Delay" is not in the key r['audits']['metrics']['details'] but it is very important to retrieve also
the "Max Potential First Input Delay" statistic. The maximum potential First Input Delay that users could experience
is the duration, in milliseconds, of the longest task. It is available in the key r['audits']['max-potential-fid'].
            "max-potential-fid": {
                "id": "max-potential-fid",
                "title": "Max Potential First Input Delay",
                …
                "score": 0.77,
                "numericValue": 172
            },
        try:
          p['maxfid'] = r['audits']['max-potential-fid']['numericValue']
        except Exception:
          p['maxfid']='null'
Third Party summary
A very, very important statistic to extract and store : the third party impacts on page loads (sharing tools, Google analytics, Google Ads…). These
libraries may have a very important negative influence. The loading method must sometimes be reviewed for some of them
to limit their impact: async or defer mode, "lazy load" (loading if the user scrolls visually to an element).
A summary is available in the key r['audits']['third-party-summary']['details']['summary']
    "lighthouseResult": {
      …
      "audits": {
        …
        "third-party-summary": {
                "id": "third-party-summary",
                "title": "Minimize third-party usage",
                "score": 1,
                "details": {
                    "summary": {
                        "wastedBytes": 219053,
                        "wastedMs": 11.327000000000005
                    },
The metrics wastedMs gives the total time in milliseconds Third Party libraries have blocked the main thread : very useful
to define the strategy async | defer, when to load the third party library and so on.
The report even displays details per third party library ! Great feature. Be careful : in the details per item,
mainThreadTime is not the blocking time in milliseconds, but the relative start time in the timeline load page.
                    "items": [
                        {
                            "entity": {
                                "type": "link",
                                "text": "Google/Doubleclick Ads",
                                "url": "https://www.doubleclickbygoogle.com/"
                            },
                            "mainThreadTime": 352.3499999999992,
                            "transferSize": 197607,
                            "blockingTime": 11.327000000000005
                        },
                        {
                            "entity": {
                                "type": "link",
                                "text": "Google Analytics",
                                "url": "https://www.google.com/analytics/analytics/"
                            },
                            "mainThreadTime": 39.71400000000002,
                            "transferSize": 20064,
                            "blockingTime": 0
                        }, …
The Third party libraries summary is added in the extraction :
      try:
        p['3dpWeight'] = r['audits']['third-party-summary']['details']['summary']['wastedBytes']
        p['3dpBlockingTime'] = r['audits']['third-party-summary']['details']['summary']['wastedMs']
      except Exception:
        p['3dpWeight'] = 'null'
        p['3dpBlockingTime'] = 'null'
The final extraction program
Now we have decided the metrics to be extracted, the full url is added in the dictionary and
a flag is also added in order to better identify a measure (before a migration, an enhancement update…),
later this flag will be filled in by an argument given to the program.
The test duration time in seconds available in the key r['timing'] (ms) is integrated too :
    "lighthouseResult": {
      …
      "timing":  {
            "total": 12407.03
        }
…
p['url'] = q['url']
…
p['flag'] = ''
…
try:
p['duration'] = r['timing']['total']/1000
except Exception:
p['duration'] = 'null'The final program looks like this :
…
  if (rj.status_code==200):
    fullresults = json.loads(rj.text)
    p = {}

    measuretime = datetime.now()
    p['date_measure'] = measuretime.strftime('%Y-%m-%d %H:%M:%S')
    p['url'] = q['url']
    p['resultfile'] = '%s_%s.json' % (q['url'].replace('.html','').split('/').pop(), measuretime.strftime('%Y%m%d%H%M%S'))
    p['device'] = 'D' if q['strategy'] == 'DESKTOP' else 'M'
    p['flag'] = ''

    if (fullresults.get('lighthouseResult') != None):

      with open(os.getenv('LOG') + '/' + p['resultfile'],'w') as f:
        json.dump(fullresults,f,indent=4, ensure_ascii=False)

      r = fullresults.get('lighthouseResult')


      categories = ['performance', 'accessibility','best-practices','seo']

      for category in categories:
        try:
          p[category] = r['categories'][category]['score']*100
        except Exception:
           p[category] = 'null'

      with open(os.getenv('CFG') + '/speed-metadata.json','r') as m:
        metadata = json.load(m)

      sections = ['metrics', 'diagnostics']
      for section in sections:
        for s in metadata[section]:
          try:
            p[s] = r['audits'][section]['details']['items'][0][s]
          except Exception:
            p[s] = 'null'

      try:
        p['maxfid'] = r['audits']['max-potential-fid']['numericValue']
      except Exception:
        p['maxfid'] = 'null'

      try:
        p['3dpWeight'] = r['audits']['third-party-summary']['details']['summary']['wastedBytes']
        p['3dpBlockingTime'] = r['audits']['third-party-summary']['details']['summary']['wastedMs']
      except Exception:
        p['3dpWeight'] = 'null'
        p['3dpBlockingTime'] = 'null'
The resulting dictionary p is then the following for example :
{
    "date_measure": "2020-05-07 08:40:42",
    "url": "https://www.sqlpac.com/referentiel/docs/influxdb-v1.7-architecture-installation-configuration-utilisation.html",
    "resultfile": "influxdb-v1.7-architecture-installation-configuration-utilisation_20200509012942.json",
    "device": "D",
    "flag": "",
    "duration": 11.88095,
    "performance": 86.0,
    "accessibility": 87.0,
    "best-practices": 100,
    "seo": 100,
    "firstContentfulPaint": 520,
    "firstMeaningfulPaint": 520,
    "largestContentfulPaint": 1920,
    "speedIndex": 1417,
    "firstCPUIdle": 1381,
    "interactive": 3502,
    "estimatedInputLatency": 13,
    "observedDomContentLoaded": 155,
    "observedLoad": 224,
    "totalBlockingTime": 57,
    "cumulativeLayoutShift": 0.004959294866182179,
    "numRequests": 104,
    "mainDocumentTransferSize": 14568,
    "totalByteWeight": 436237,
    "numTasks": 1180,
    "totalTaskTime": 1320.9420000000018,
    "numTasksOver10ms": 27,
    "numTasksOver25ms": 14,
    "numTasksOver50ms": 4,
    "numTasksOver100ms": 3,
    "numTasksOver500ms": 0,
    "numFonts": 1,
    "numScripts": 31,
    "numStylesheets": 10,
    "maxfid": 153,
    "3dpWeight": 217527,
    "3dpBlockingTime": 15.482
}
Storing the results
Once the dictionary is ready, many options to store the results : database, file…
The results will be stored in a MySQL database in this use case. The program Python does not manage the insertion to the database as it is not accessible directly (cloud provider constraints).
The table structure reflects the dictionary structure :
create table perf_pagespeed (
    date_measure datetime not null,
    url varchar(512) not null,
    resultfile varchar(512) not null,
    device enum ('D','M') not null,
    flag varchar(30) null,
    duration float,
    performance int(3) null,
    accessibility int(3) null,
    `best-practices` int(3) null,
    seo int(3) null,
    firstContentfulPaint int null,
    firstMeaningfulPaint int null,
    largestContentfulPaint int null,    /** new in LightHouse 6 */
    speedIndex int null,
    firstCPUIdle int null,
    interactive int null,
    estimatedInputLatency int null,
    observedDomContentLoaded int null,
    observedLoad int null,
    totalBlockingTime int null,
    cumulativeLayoutShift float null,   /** new in LightHouse 6 */
    numRequests int null,
    mainDocumentTransferSize int null,
    totalByteWeight int null,
    numTasks int null,
    totalTaskTime float null,
    numTasksOver10ms int null,
    numTasksOver25ms int null,
    numTasksOver50ms int null,
    numTasksOver100ms int null,
    numTasksOver500ms int null,
    numFonts int null,
    numScripts int null,
    numStylesheets int null,
    maxfid int null,
    `3dpWeight` int null,
    `3dpBlockingTime` int null
)
The python program sends the dictionary using the POST method with the package requests to a PHP secured page with basic authentication :
requests.post('https://www.sqlpac.com/rpc/rpcu-pagespeed.php', data = p, auth=HTTPBasicAuth('<user>', '************'))
The PHP program generates dynamically the syntax using the POST variables names received and executes the INSERT statement :
insert into perf_pagespeed (
  `date_measure`,
  `url`,
  `resultfile`,
  `device`,
  `flag`,
  `duration`,
  `performance`,`accessibility`,`best-practices`,`seo`,
  `firstContentfulPaint`,`firstMeaningfulPaint`,`largestContentfulPaint`,
  `speedIndex`,`firstCPUIdle`,`interactive`,`estimatedInputLatency`,
  `observedDomContentLoaded`,`observedLoad`,`totalBlockingTime`,
  `cumulativeLayoutShift`,
  `numRequests`,`mainDocumentTransferSize`,`totalByteWeight`,
  `numTasks`,`totalTaskTime`,`numTasksOver10ms`,`numTasksOver25ms`,`numTasksOver50ms`,`numTasksOver100ms`,`numTasksOver500ms`,
  `numFonts`,`numScripts`,`numStylesheets`,
  `maxfid`,`3dpWeight`,`3dpBlockingTime`)
values (
  '2020-05-07 10:39:44',
  'https://www.sqlpac.com/referentiel/docs/influxdb-v1.7-architecture-installation-configuration-utilisation.html',
  'influxdb-v1.7-architecture-installation-configuration-utilisation_20200509023944.json',
  'D',
  '',
  13.168520000000001,
  87.0,87.0,92.0,100,
  520,520,1920,
  1448,1056,3321,13,
  227,338,33,
  0.004959294866182179,
  104,14583,435780,
  1173,1512.4969999999985,39,14,6,1,0,
  1,31,10,
  116,217042,0)
rpcu_pagespeed.php
<?php

require_once('./include/config.inc');

$resp = array();

  $conn=mysqli_connect('localhost','sqlpac_rw','********','sqlpacdb',40000);
  mysqli_set_charset($conn,"utf8");

   if ( ! $conn ) {
      $resp[0]["returncode"] = -2;
      $resp[0]["reason"] = "Connexion to database issue";
   }
   else {
      $cols="insert into perf_pagespeed (";
      $values=" values (";
      $i=1;
      foreach ($_POST as $key=>$value) {
         if ($i > 1) { $cols .= ","; $values .= ","; }
         $i++;
         $cols .= "`".$key."`";
         if (! is_numeric($value)) { $values .= "'"; }
         $values .= $value;
         if (! is_numeric($value)) { $values .= "'"; }
      }
      $cols .= ") ";
      $values .= ") ";
      $sql = $cols." ".$values;
      if ( ! mysqli_query($conn,$sql) ) {
         $resp[0]["returncode"] = -2;
         $resp[0]["errorcode"] = mysqli_errno($conn);
         $resp[0]["reason"] = mysqli_error($conn);
      } else {
         $resp[0]["returncode"] = mysqli_affected_rows($conn);
         $resp[0]["url"] = $_POST["url"];
         $resp[0]["datets"] = $_POST["date_measure"];
      }
      mysqli_close($conn);
   }

print json_encode($resp);
?>
Enhancing the program
The program named speed.py is enhanced to add arguments and iterations
sqlpac@vpsfrsqlpac2$ python3 speed.py --helpusage: speed.py [-h] -p PAGE [-m] [-o LOCALE] [-i ITERATION] optional arguments: -h, --help show this help message and exit -p PAGE, --page PAGE Page -m, --mobile Device mobile -o LOCALE, --locale LOCALE Output language results -i ITERATION, --iteration ITERATION Number of iterations -f FLAG, --flag FLAG Identifier flag
To implement arguments :
import argparse
…

def run_pagespeed():
    …
    q = { 'url': args.page,
          'key': apikey ,
          'strategy': args.device,
          'category':['PERFORMANCE','ACCESSIBILITY','BEST_PRACTICES','SEO'],
          'locale': args.locale }
    …

        p['url'] = args.page
        …
        p['device'] = 'D' if args.device=='DESKTOP' else 'M'
        p['flag'] = args.flag

    …

def run_args():
    mparser= argparse.ArgumentParser()
    mparser.add_argument('-p','--page', help='Page', required=True)
    mparser.add_argument('-m','--mobile', help='Device mobile', action='store_false')
    mparser.add_argument('-o','--locale', help='Output language results', default='en')
    mparser.add_argument('-i','--iteration', help='Number of iterations', default=1, type=int)
    mparser.add_argument('-f','--flag', help='Identifier flag', default='')
    global args
    args = mparser.parse_args()

def main():
    run_args()

    args.device='DESKTOP' if args.mobile!=False else 'MOBILE'

    i=1
    while i <= args.iteration:
        run_pagespeed()
        i += 1

if (__name__=="__main__"):
    main()
An example usage : 20 iterations, mobile test with the flag "before mig 5.9"
python3 speed.py -i 20 -m -f "before mig 5.9" \
           -p https://www.sqlpac.com/referentiel/docs/influxdb-v1.7-architecture-installation-configuration-utilisation.html
Use case
A framework library is migrated from version 5.8 to version 5.9 with performance enhancements. Benchmarks for the desktop device are recorded for the page
https://www.sqlpac.com/referentiel/docs/influxdb-v1.7-architecture-installation-configuration-utilisation.html before and after :
python3 speed.py -p <influxdb-v1.7-architecture-installation-configuration-utilisation.html> \
                 -i 40 -f "Version 5.8"
python3 speed.py -p <influxdb-v1.7-architecture-installation-configuration-utilisation.html> \
-i 40 -f "Version 5.9"Performance score is increased from 75% to 86%.
SELECT
	flag,
	AVG(performance) AS performance,
	AVG(accessibility) AS accessibility,
	AVG(`best-practices`) AS `best-practices`,
	AVG(seo) AS seo,
	AVG(speedindex) AS speedindex,
	AVG(firstCPUIdle ) AS firstCPUIdle,
	AVG(interactive) AS interactive,
	AVG(totalBlockingTime) AS totalBlockingTime,
	AVG(observedDomContentLoaded) AS observedDomContentLoaded,
	AVG(observedLoad) AS observedLoad,
	AVG(3dpWeight) AS 3dpWeight,
	AVG(3dpBlockingTime) AS 3dpBlockingTime
FROM perf_pagespeed
WHERE flag IN ('Version 5.8','Version 5.9')
GROUP BY flag
In this use case, the performance has been drastically enhanced by deferring the load of the third party library Disqus only when the user scrolls to the comments section. It has been easily identified in the JSON result audit :
            "third-party-summary": {
                "id": "third-party-summary",
                "title": "Minimize third-party usage",
                "description": "Third-party code can significantly impact load performance. Limit the number of redundant third-party providers and try to load third-party code after your page has primarily finished loading. [Learn more](https://developers.google.com/web/fundamentals/performance/optimizing-content-efficiency/loading-third-party-javascript/).",
                …
                "details": {
                    "summary": {
                        "wastedBytes": 956402,
                        "wastedMs": 109.181
                    },
                    …
                    "type": "table",
                    "items": [
                        {
                            "transferSize": 566804,
                            "blockingTime": 109.181,
                            "entity": {
                                "url": "http://disqus.com/",
                                "text": "Disqus",
                                "type": "link"
                            },
                            "mainThreadTime": 573.4169999999991
                        },