
Introduction
How to set x axis labels to multiples of \(\pi\), including fractions, for trigonometric functions ?
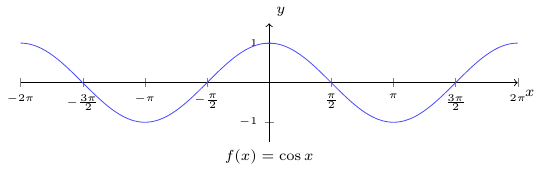
Cosinus trigonometric function
For the graph \( f(x)=\cos(x) \) above in the domain \([-2\pi,2\pi]\),
define xtick and xticklabels in the axis properties. :
\documentclass[tikz]{standalone}

\usepackage{pgfplots}
\usepackage{amsmath,amssymb,amsfonts}

\pgfplotsset{compat=newest}

\pgfplotsset{every axis/.append style={
                    axis x line=middle,
                    axis y line=middle,
                    axis line style={->},
                    xlabel={$x$},
                    ylabel={$y$},
                    label style={font=\scriptsize},
                    tick label style={font=\tiny},
                    unit vector ratio*=1 1 1,
                    xlabel style={at={(ticklabel* cs:1)},anchor=north west},
                    ylabel style={at={(ticklabel* cs:1)},anchor=south west}
                 }}

\begin{document}

  \begin{tikzpicture}

   \begin{axis}[
      name = graphcos,
      width=10cm, height=5cm,
      ytick distance = 1,
      ymin=-1.5, ymax=1.5,
      xtick={
           -2*pi, -(3*pi)/2, -pi, -pi/2,
           pi/2, pi, (3*pi)/2, 2*pi
        },
      xticklabels={
           $-2\pi$, $-\frac{3\pi}{2}$, $-\pi$, $-\frac{\pi}{2}$,
           $\frac{\pi}{2}$, $\pi$, $\frac{3\pi}{2}$, $2\pi$
        },
      domain=-2*pi:2*pi
   ]

     \addplot [samples=500, color=blue!70]
        {cos(deg(x))};

   \end{axis}
   \node[anchor=north] at (graphcos.south) {\scriptsize $f(x)=\cos x$};

  \end{tikzpicture}

\end{document}
Tangent trigonometric function
A more complex example : the tangent trigonometric function which is not continuous. The tangent function \( f(x)=\tan(x) \) is not defined for \( \pm \dfrac{\pi}{2} \) and \( \pm \dfrac{3\pi}{2} \).
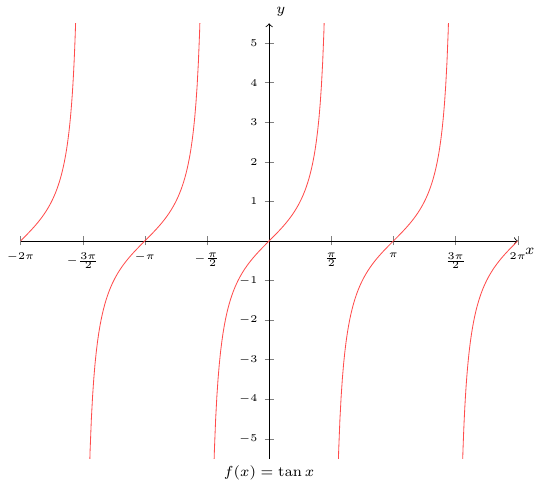
xtick and xticklabels properties are the same ones defined for the cosinus function graph,
the function addplot is called on each interval for which the tangent function \( f(x)=\tan(x) \) is defined and continuous.
- \([-2\ \pi:-1.51\ \pi]\)
- \([-1.49\ \pi:-0.51\ \pi]\)
- \([-0.49\ \pi:0.49\ \pi]\)
- \([0.51\ \pi:1.49\ \pi]\)
- \([1.51\ \pi:2\ \pi]\)
            \documentclass[tikz]{standalone}

\usepackage{pgfplots}
\usepackage{amsmath,amssymb,amsfonts}

\pgfplotsset{compat=newest}

\pgfplotsset{every axis/.append style={
                    axis x line=middle,
                    axis y line=middle,
                    axis line style={->},
                    xlabel={$x$},
                    ylabel={$y$},
                    label style={font=\scriptsize},
                    tick label style={font=\tiny},
                    unit vector ratio*=1 1 1,
                    xlabel style={at={(ticklabel* cs:1)},anchor=north west},
                    ylabel style={at={(ticklabel* cs:1)},anchor=south west}
                 }}

\begin{document}

  \begin{tikzpicture}

   \begin{axis}[
      name = graphtan,
      width=10cm, height=10cm,
      ytick distance = 1,
      xmin=-2*pi, xmax=2*pi,
      ymin=-5.5 ,ymax=5.5,
      xtick={
           -2*pi, -(3*pi)/2, -pi, -pi/2,
           pi/2, pi, (3*pi)/2, 2*pi
       },
      xticklabels={
           $-2\pi$, $-\frac{3\pi}{2}$, $-\pi$, $-\frac{\pi}{2}$,
           $\frac{\pi}{2}$, $\pi$, $\frac{3\pi}{2}$, $2\pi$
       },
      domain=-2*pi:2*pi
   ]

     \addplot [domain=-2*pi:-1.51*pi, samples=100, color=red!70]
        {tan(deg(x))};
     \addplot [domain=-1.49*pi:-0.51*pi, samples=100, color=red!70]
        {tan(deg(x))};
     \addplot [domain=-0.49*pi:0.49*pi, samples=100, color=red!70]
        {tan(deg(x))};
     \addplot [domain=0.51*pi:1.49*pi, samples=100, color=red!70]
        {tan(deg(x))};
     \addplot [domain=1.51*pi:2*pi, samples=100, color=red!70]
        {tan(deg(x))};

   \end{axis}
   \node[anchor=north] at (graphtan.south) {\scriptsize $f(x)=\tan x$};

  \end{tikzpicture}

\end{document}