
Introduction
In scientific publications, sophisticated schemas are created in Latex documents using packages (circuitikz for electric circuits, chemfig for chemical molecules…).
To duplicate and insert the schemas in HTML pages, there is an easy way to produce png image files from the PDF Latex documents containing the schemas without using tools like Gimp, Photoshop.
How to create png image files from schemas in Latex documents using MiKTeX and TexMaker ?
Standalone mode
For one schema, create a Latex document in standalone mode.
guanine.tex
\documentclass[margin=5mm]{standalone}
\usepackage{chemfig}
\begin{document}
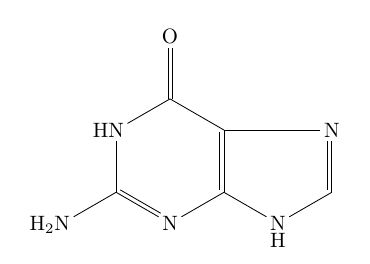
\chemfig{*6((-H_2N)=N-*6(-\chembelow{N}{H}-=N?)=?-(=O)-HN-[,,2])}
\end{document}Margins may have to be adjusted using the options [margin=…] : in some circumstances, schema may be truncated.
pdftoppm
Compile the standalone document to PDF format and then use pdftoppm available in the MiKTeX distribution
to generate the png image file from the pdf file :
% cd D:\projects\Tex\pub

% pdftoppm -png guanine.pdf > guanine.png
A Jpeg format is generated with the option -jpeg.
Multiple schemas in one Latex document, tikz
We may not want to store one schema per file. Still in standalone mode, set the document class to tikz
to produce one schema per page in a Latex document. Each page is adjusted to the size of the schema.
chemistry.tex
\documentclass[tikz,margin=5mm]{standalone}
\usepackage{chemfig}
\begin{document}
% Page 1 : guanine
\chemfig{*6((-H_2N)=N-*6(-\chembelow{N}{H}-=N?)=?-(=O)-HN-[,,2])}
% Page 2 : Benzene
\chemfig{**6(------)}
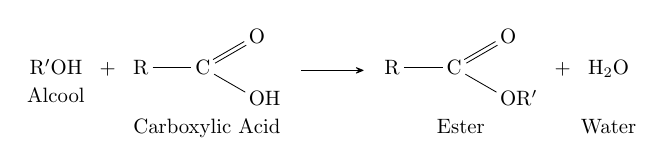
% Page 3 : Esterification
\schemestart
\chemname{\chemfig{R’OH}}{Alcool}
\+
\chemname{\chemfig{R-C(-[:-30]OH)=[:30]O}}{Carboxylic Acid}
\arrow(.mid east--.mid west)
\chemname{\chemfig{R-C(-[:-30]OR’)=[:30]O}}{Ester}
\+
\chemname{\chemfig{H_2O}}{Water}
\schemestop
\chemnameinit{}
\end{document}In the above example :
- Page 1 : guanine molecule
- Page 2 : benzene molecule
- Page 3 : esterification reaction
Use the options -f (first page) and -l (last page) to generate the png file for one schema :
% cd D:\projects\Tex\pub

% pdftoppm -f 2 -l 2 -png chemistry.pdf > benzene.png

% pdftoppm -f 3 -l 3 -png chemistry.pdf > esterification-reaction.png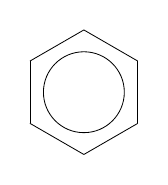
TikzPicture
The method works for multiple schemas TikzPicture.
% cd D:\projects\Tex\pub
% pdftoppm -f 1 -l 1 -png function.pdf > f-variation.png
% pdftoppm -f 2 -l 2 -png function.pdf > f-graph.png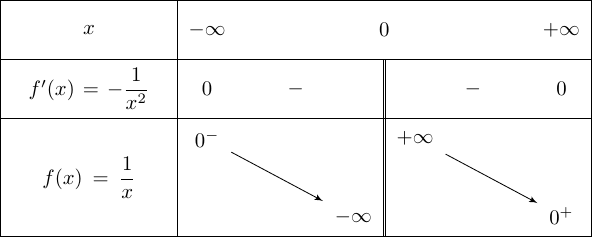
function.tex
\documentclass[tikz]{standalone}
\usepackage{pgfplots}
\pgfplotsset{compat=newest}
\usepackage{tkz-tab}
\usepackage{amsmath}
\begin{document}
% Page 1 : Function variation
\begin{tikzpicture}
\tkzTabInit[lgt=3]%
{$x$ /1,%
$f'(x)=-\dfrac{1}{2x^2}$ /1,%
$f(x)=\dfrac{1}{x}$ /2}%
{$-\infty$ , $0$ , $+\infty$}%
\tkzTabLine{ 0, -, d, -, 0}
\tkzTabVar{+/ $0^-$, -D+/ $-\infty$/ $+\infty$, -/ $0^+$}
\end{tikzpicture}
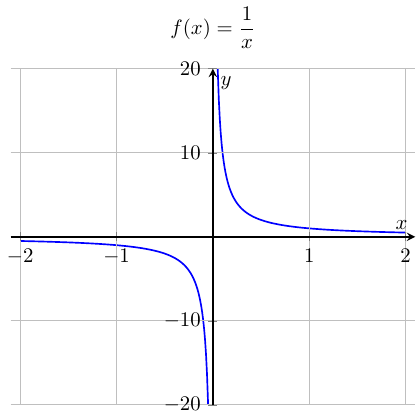
% Page 2 : Graph Function
\begin{tikzpicture}
\begin{axis}[ xlabel={$x$}, ylabel={$y$}
,axis lines=middle
,samples=200, grid, thick
,domain=-10:10,
,ymin = -20, ymax = 20
,xmin = -2.1, xmax = 2.1
,axis on top=true
,title={$f(x)=\dfrac{1}{x}$}
]
\addplot [domain=-2:-0.001, no marks, blue] {1/x)};
\addplot [domain=0.001:2,no marks, blue] {1/x)};
\end{axis}
\end{tikzpicture}
\end{document}