Introduction
In a Latex document, how to create graphs on a millimeter paper ? How to automate millimeter paper backgrounds using Tex macros ?
Code sample
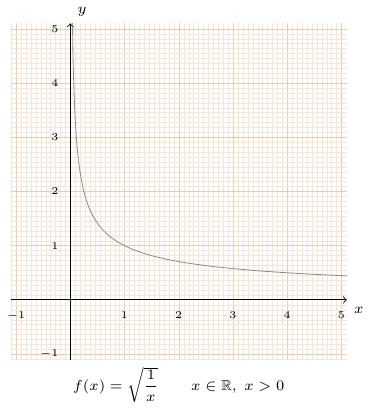
The code for the graph above on the left is the following :
\documentclass[tikz]{standalone}

\usepackage{pgfplots}
\usepackage{amsmath,amssymb,amsfonts}

\pgfplotsset{compat=newest}
\pgfplotsset{every axis/.append style={
                    axis x line=middle,
                    axis y line=middle,
                    axis line style={->},
                    xlabel={$x$},
                    ylabel={$y$},
                    label style={font=\scriptsize},
                    tick label style={font=\tiny},
                    unit vector ratio*=1 1 1,
   					xlabel style={at={(ticklabel* cs:1)},anchor=north west},
   					ylabel style={at={(ticklabel* cs:1)},anchor=south west}
                    }}

\begin{document}

  \begin{tikzpicture}

   \begin{axis}[
	 name = graph1,
     ytick distance = 1,
     xtick distance = 1,
     ymin=-1.1, ymax=5.1,
     xmin=-1.1, xmax=5.1,
     grid=both,
     grid style={line width=.1pt,draw=brown!20},
     major grid style={line width=.2pt,draw=brown!40},
     minor tick num=10,
     tick style={draw=none},
   ]

     \addplot [domain=0.01:10, samples=500, color=gray!90]
        {sqrt(1/x)};

   \end{axis}
   \node[anchor=north] at (graph1.south) {\scriptsize $f(x)=\sqrt {\dfrac{1}{x}}  \qquad x \in \mathbb{R}  ,\; x > 0 $};

  \end{tikzpicture}

\end{document}
To setup the millimeter paper in the background, the following axis properties are defined :
\begin{axis}[
…
     grid=both,
     grid style={line width=.1pt,draw=brown!20},
     major grid style={line width=.2pt,draw=brown!40},
     minor tick num=10,
     tick style={draw=none},
…
]
Automating millimeter paper in a macro
Macro creation
We don’t want to duplicate the code for each graph.
Create a macro axispapermm defining the millimiter paper axis properties in a sty file :
ppm.sty
\ProvidesPackage{ppm}[2021 Millimeter paper macros]

\newcommand{\axispapermm}{grid=both,
 grid style={line width=.1pt,draw=brown!20},
 major grid style={line width=.2pt,draw=brown!40},
 minor tick num=10,
 tick style={draw=none}
}
Import the package and call the macro axispapermm
\documentclass[tikz]{standalone}
\usepackage{pgfplots}
\usepackage{amsmath,amssymb,amsfonts}
\usepackage{ppm}
\pgfplotsset{compat=newest}
\pgfplotsset{every axis/.append style={
axis x line=middle,
axis y line=middle,
axis line style={->},
xlabel={$x$},
ylabel={$y$},
label style={font=\scriptsize},
tick label style={font=\tiny},
unit vector ratio*=1 1 1,
xlabel style={at={(ticklabel* cs:1)},anchor=north west},
ylabel style={at={(ticklabel* cs:1)},anchor=south west}
}}
\begin{document}
\begin{tikzpicture}
\begin{axis}[
name = graph1,
ytick distance = 1,
xtick distance = 1,
ymin=-1.1, ymax=5.1,
xmin=-1.1, xmax=5.1,
\axispapermm
]
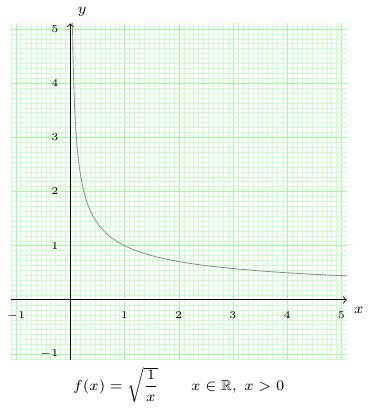
\addplot [domain=0.01:10, samples=500, color=gray!90]
{sqrt(1/x)};
\end{axis}
\node[anchor=north] at (graph1.south) {\scriptsize $f(x)=\sqrt {\dfrac{1}{x}} \qquad x \in \mathbb{R} ,\; x > 0 $};
\end{tikzpicture}
\end{document}Customizing the color
The axispapermm macro is then enhanced to to set the color as an argument.
ppm.sty
\ProvidesPackage{ppm}[2021 Millimeter paper macros]

\newcommand{\axispapermm}[1]{grid=both,
   grid style={line width=.1pt,draw=#1!20},
   major grid style={line width=.2pt,draw=#1!40},
   minor tick num=10,
   tick style={draw=none}
}
\documentclass[tikz]{standalone}
\usepackage{pgfplots}
\usepackage{amsmath,amssymb,amsfonts}
\usepackage{ppm}
\pgfplotsset{compat=newest}
\pgfplotsset{every axis/.append style={
axis x line=middle,
axis y line=middle,
axis line style={->},
xlabel={$x$},
ylabel={$y$},
label style={font=\scriptsize},
tick label style={font=\tiny},
unit vector ratio*=1 1 1,
xlabel style={at={(ticklabel* cs:1)},anchor=north west},
ylabel style={at={(ticklabel* cs:1)},anchor=south west}
}}
\begin{document}
\begin{tikzpicture}
\begin{axis}[
name = graph1,
ytick distance = 1,
xtick distance = 1,
ymin=-1.1, ymax=5.1,
xmin=-1.1, xmax=5.1,
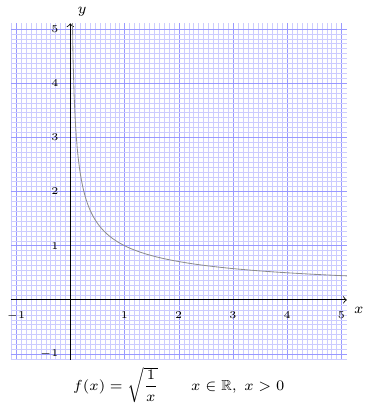
\axispapermm{blue}
]
\addplot [domain=0.01:10, samples=500, color=gray!90]
{sqrt(1/x)};
\end{axis}
\node[anchor=north] at (graph1.south) {\scriptsize $f(x)=\sqrt {\dfrac{1}{x}} \qquad x \in \mathbb{R} ,\; x > 0 $};
\end{tikzpicture}
\end{document}