Introduction
Dans un document Latex, comment créer des graphiques sur papier millimétré ? Comment automatiser les arrières plans papier millimétré avec une macro Tex ?
Code exemple
Le code pour le graphique à gauche ci-dessus est le suivant :
\documentclass[tikz]{standalone}
\usepackage{pgfplots}
\usepackage{amsmath,amssymb,amsfonts}
\pgfplotsset{compat=newest}
\pgfplotsset{every axis/.append style={
axis x line=middle,
axis y line=middle,
axis line style={->},
xlabel={$x$},
ylabel={$y$},
label style={font=\scriptsize},
tick label style={font=\tiny},
unit vector ratio*=1 1 1,
xlabel style={at={(ticklabel* cs:1)},anchor=north west},
ylabel style={at={(ticklabel* cs:1)},anchor=south west}
}}
\begin{document}
\begin{tikzpicture}
\begin{axis}[
name = graph1,
ytick distance = 1,
xtick distance = 1,
ymin=-1.1, ymax=5.1,
xmin=-1.1, xmax=5.1,
grid=both,
grid style={line width=.1pt,draw=brown!20},
major grid style={line width=.2pt,draw=brown!40},
minor tick num=10,
tick style={draw=none},
]
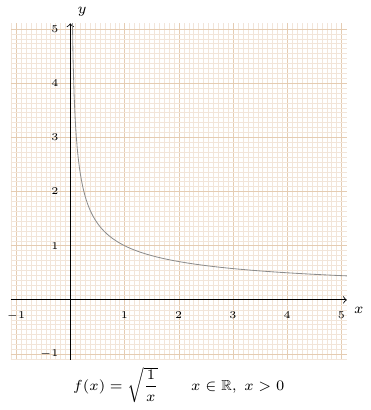
\addplot [domain=0.01:10, samples=500, color=gray!90]
{sqrt(1/x)};
\end{axis}
\node[anchor=north] at (graph1.south) {\scriptsize $f(x)=\sqrt {\dfrac{1}{x}} \qquad x \in \mathbb{R} ,\; x > 0 $};
\end{tikzpicture}
\end{document}Pour appliquer le papier millimétré en arrière plan, les propriétés des axes suivantes sont définies :
\begin{axis}[
…
     grid=both,
     grid style={line width=.1pt,draw=brown!20},
     major grid style={line width=.2pt,draw=brown!40},
     minor tick num=10,
     tick style={draw=none},
…
]
Automatiser le papier millimétré dans une macro
Création de la macro
On ne veut pas dupliquer le code pour chaque graphique.
Créer une macro axispapermm définissant les propriétés des axes pour le papier millimétré dans un fichier sty :
ppm.sty
\ProvidesPackage{ppm}[2021 Millimeter paper macros]

\newcommand{\axispapermm}{grid=both,
 grid style={line width=.1pt,draw=brown!20},
 major grid style={line width=.2pt,draw=brown!40},
 minor tick num=10,
 tick style={draw=none}
}
Importer le package et appeler la macro axispapermm
\documentclass[tikz]{standalone}
\usepackage{pgfplots}
\usepackage{amsmath,amssymb,amsfonts}
\usepackage{ppm}
\pgfplotsset{compat=newest}
\pgfplotsset{every axis/.append style={
axis x line=middle,
axis y line=middle,
axis line style={->},
xlabel={$x$},
ylabel={$y$},
label style={font=\scriptsize},
tick label style={font=\tiny},
unit vector ratio*=1 1 1,
xlabel style={at={(ticklabel* cs:1)},anchor=north west},
ylabel style={at={(ticklabel* cs:1)},anchor=south west}
}}
\begin{document}
\begin{tikzpicture}
\begin{axis}[
name = graph1,
ytick distance = 1,
xtick distance = 1,
ymin=-1.1, ymax=5.1,
xmin=-1.1, xmax=5.1,
\axispapermm
]
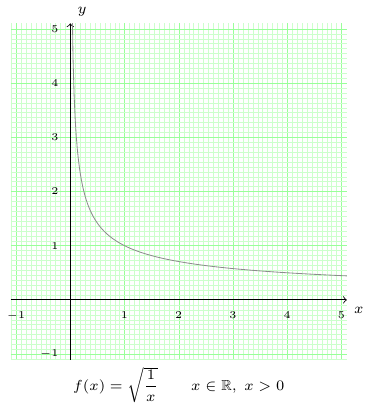
\addplot [domain=0.01:10, samples=500, color=gray!90]
{sqrt(1/x)};
\end{axis}
\node[anchor=north] at (graph1.south) {\scriptsize $f(x)=\sqrt {\dfrac{1}{x}} \qquad x \in \mathbb{R} ,\; x > 0 $};
\end{tikzpicture}
\end{document}Personnalisation de la couleur
La macro axispapermm est alors amélioré pour permettre de donner la couleur du papier millimétré en argument.
ppm.sty
\ProvidesPackage{ppm}[2021 Millimeter paper macros]

\newcommand{\axispapermm}[1]{grid=both,
   grid style={line width=.1pt,draw=#1!20},
   major grid style={line width=.2pt,draw=#1!40},
   minor tick num=10,
   tick style={draw=none}
}
\documentclass[tikz]{standalone}
\usepackage{pgfplots}
\usepackage{amsmath,amssymb,amsfonts}
\usepackage{ppm}
\pgfplotsset{compat=newest}
\pgfplotsset{every axis/.append style={
axis x line=middle,
axis y line=middle,
axis line style={->},
xlabel={$x$},
ylabel={$y$},
label style={font=\scriptsize},
tick label style={font=\tiny},
unit vector ratio*=1 1 1,
xlabel style={at={(ticklabel* cs:1)},anchor=north west},
ylabel style={at={(ticklabel* cs:1)},anchor=south west}
}}
\begin{document}
\begin{tikzpicture}
\begin{axis}[
name = graph1,
ytick distance = 1,
xtick distance = 1,
ymin=-1.1, ymax=5.1,
xmin=-1.1, xmax=5.1,
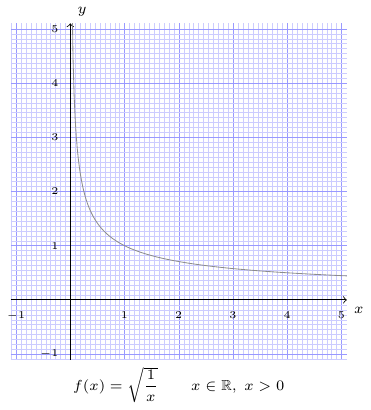
\axispapermm{blue}
]
\addplot [domain=0.01:10, samples=500, color=gray!90]
{sqrt(1/x)};
\end{axis}
\node[anchor=north] at (graph1.south) {\scriptsize $f(x)=\sqrt {\dfrac{1}{x}} \qquad x \in \mathbb{R} ,\; x > 0 $};
\end{tikzpicture}
\end{document}